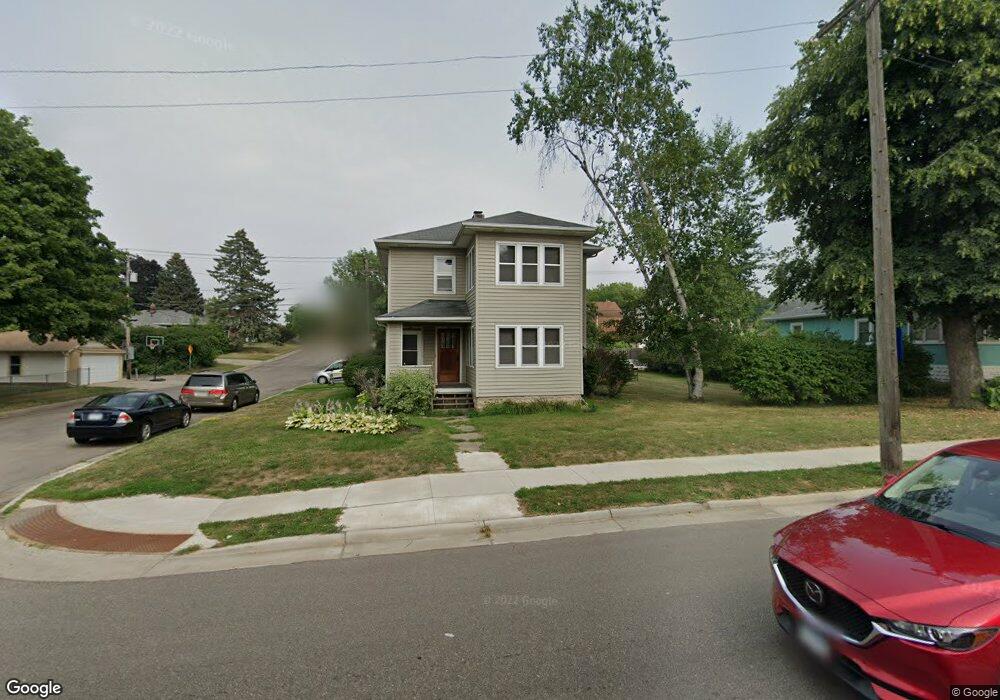
922 Smith Ave S Saint Paul, MN 55118
Estimated Value: $312,000 - $436,842
4
Beds
2
Baths
2,320
Sq Ft
$164/Sq Ft
Est. Value
About This Home
This home is located at 922 Smith Ave S, Saint Paul, MN 55118 and is currently estimated at $380,211, approximately $163 per square foot. 922 Smith Ave S is a home located in Dakota County with nearby schools including Somerset Elementary School, Heritage E-STEM Magnet School, and Two Rivers High School.
Ownership History
Date
Name
Owned For
Owner Type
Purchase Details
Closed on
Oct 13, 2017
Sold by
Johanson Todd L and Johanson Dawn
Bought by
Anderson Kari A
Current Estimated Value
Home Financials for this Owner
Home Financials are based on the most recent Mortgage that was taken out on this home.
Original Mortgage
$178,500
Outstanding Balance
$149,098
Interest Rate
3.82%
Mortgage Type
New Conventional
Estimated Equity
$231,113
Purchase Details
Closed on
Sep 27, 2000
Sold by
Rygh Laura R
Bought by
Johanson Todd L and Turnage Tina R
Purchase Details
Closed on
Jan 29, 1999
Sold by
Emerson Marcella V
Bought by
Nedved Jonathan Peter and Tomann Christine Lynn
Purchase Details
Closed on
Jan 28, 1999
Sold by
Nedved Jonathan Peter and Tomann Christine Lynn
Bought by
Rygh Laura R
Create a Home Valuation Report for This Property
The Home Valuation Report is an in-depth analysis detailing your home's value as well as a comparison with similar homes in the area
Home Values in the Area
Average Home Value in this Area
Purchase History
| Date | Buyer | Sale Price | Title Company |
|---|---|---|---|
| Anderson Kari A | $210,000 | Home Title Inc | |
| Johanson Todd L | $145,900 | -- | |
| Nedved Jonathan Peter | $82,500 | -- | |
| Rygh Laura R | $125,500 | -- |
Source: Public Records
Mortgage History
| Date | Status | Borrower | Loan Amount |
|---|---|---|---|
| Open | Anderson Kari A | $178,500 | |
| Closed | Nedved Jonathan Peter | -- |
Source: Public Records
Tax History Compared to Growth
Tax History
| Year | Tax Paid | Tax Assessment Tax Assessment Total Assessment is a certain percentage of the fair market value that is determined by local assessors to be the total taxable value of land and additions on the property. | Land | Improvement |
|---|---|---|---|---|
| 2024 | $5,172 | $397,100 | $62,700 | $334,400 |
| 2023 | $5,172 | $417,300 | $66,500 | $350,800 |
| 2022 | $4,336 | $364,200 | $66,200 | $298,000 |
| 2021 | $4,060 | $334,800 | $57,600 | $277,200 |
| 2020 | $3,320 | $313,200 | $54,800 | $258,400 |
| 2019 | $3,181 | $254,800 | $52,200 | $202,600 |
| 2018 | $3,636 | $234,700 | $48,800 | $185,900 |
| 2017 | $4,018 | $215,200 | $46,500 | $168,700 |
| 2016 | $3,768 | $203,600 | $42,300 | $161,300 |
| 2015 | $3,768 | $198,500 | $41,500 | $157,000 |
| 2014 | $3,552 | $180,000 | $38,500 | $141,500 |
| 2013 | $3,424 | $168,300 | $35,500 | $132,800 |
Source: Public Records
Map
Nearby Homes
- 913 Ottawa Ave
- 999 Seminole Ave
- 967 Cherokee Ave
- 822 Smith Ave S
- 801 Cherokee Ave
- 1062 Ohio St
- 1095 Cherokee Ave
- 259 Curtice St W
- 750 Delaware Ave
- 206 Winona St W
- 908 Bellows St
- 950 Bellows St
- 693 Smith Ave S
- 1000 Winston Cir
- 606 Sutcliff Cir
- 837 Bidwell St
- 663 Smith Ave S
- 1517 Timberwood Ln
- 1016 Bidwell St
- 867 Winslow Ave
- 932 Smith Ave S
- 934 Smith Ave S
- 934 Smith Ave S
- 925 Manomin Ave
- 940 Smith Ave S
- 912 912 Smith-Avenue-s
- 912 Smith Ave S
- 931 Manomin Ave
- 937 Manomin Ave
- 944 Smith Ave S
- 915 Manomin Ave
- 931 Smith Ave S
- 923 Smith Ave S
- 906 Smith Ave S
- 906 Smith Ave S
- 946 Smith Ave S
- 947 Manomin Ave
- 917 Smith Ave S
- 909 Manomin Ave
- 939 Smith Ave S