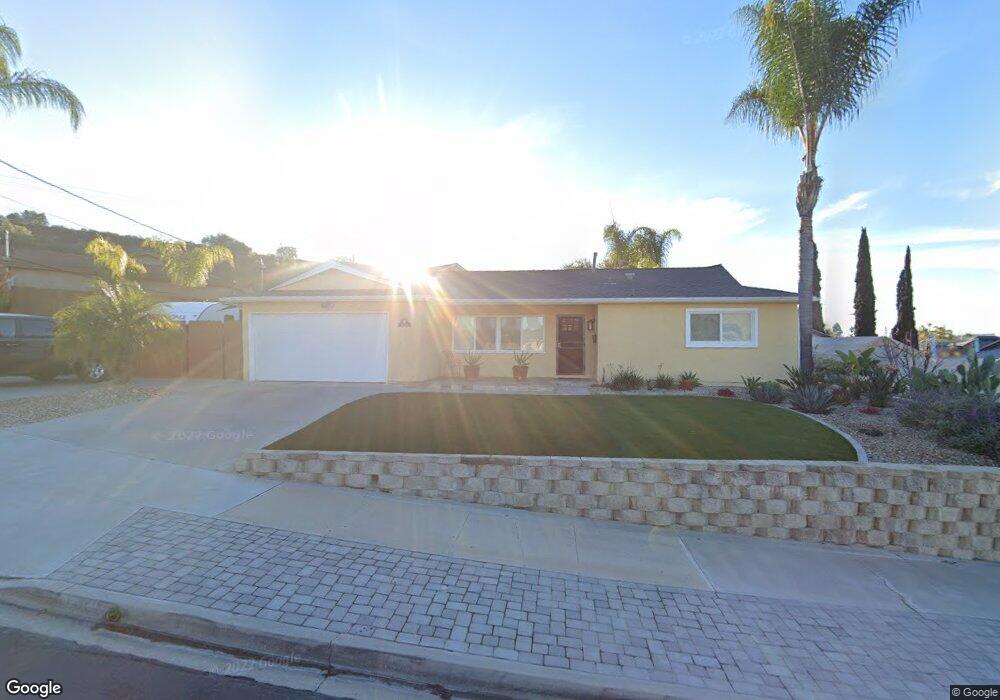
9229 Fenway Rd Santee, CA 92071
Carlton Hills NeighborhoodEstimated Value: $787,000 - $802,000
3
Beds
2
Baths
1,092
Sq Ft
$728/Sq Ft
Est. Value
About This Home
This home is located at 9229 Fenway Rd, Santee, CA 92071 and is currently estimated at $794,447, approximately $727 per square foot. 9229 Fenway Rd is a home located in San Diego County with nearby schools including Sycamore Canyon Elementary School and West Hills High School.
Ownership History
Date
Name
Owned For
Owner Type
Purchase Details
Closed on
Sep 1, 2020
Sold by
Lee Joseph and Lee Evelyn M
Bought by
Lee Joseph and Lee Evelyn M
Current Estimated Value
Home Financials for this Owner
Home Financials are based on the most recent Mortgage that was taken out on this home.
Original Mortgage
$402,502
Outstanding Balance
$357,850
Interest Rate
3%
Mortgage Type
VA
Estimated Equity
$436,597
Purchase Details
Closed on
Sep 19, 2002
Sold by
Getch Michael
Bought by
Lee Joseph J and Lee Evelyn Michelle
Home Financials for this Owner
Home Financials are based on the most recent Mortgage that was taken out on this home.
Original Mortgage
$240,000
Interest Rate
5.99%
Purchase Details
Closed on
Nov 22, 1999
Sold by
Goodman Family Trust 09-03-92 and Goodman Elsie
Bought by
Getch Michael
Home Financials for this Owner
Home Financials are based on the most recent Mortgage that was taken out on this home.
Original Mortgage
$132,000
Interest Rate
7.83%
Purchase Details
Closed on
Sep 23, 1992
Sold by
Goodman Joseph V
Bought by
Goodman Joseph and Goodman Elsie
Create a Home Valuation Report for This Property
The Home Valuation Report is an in-depth analysis detailing your home's value as well as a comparison with similar homes in the area
Home Values in the Area
Average Home Value in this Area
Purchase History
| Date | Buyer | Sale Price | Title Company |
|---|---|---|---|
| Lee Joseph | -- | North American Title Co | |
| Lee Joseph J | $300,000 | Chicago Title | |
| Getch Michael | $165,000 | Stewart Title Company | |
| Goodman Joseph | -- | -- |
Source: Public Records
Mortgage History
| Date | Status | Borrower | Loan Amount |
|---|---|---|---|
| Open | Lee Joseph | $402,502 | |
| Closed | Lee Joseph J | $240,000 | |
| Previous Owner | Getch Michael | $132,000 | |
| Closed | Lee Joseph J | $60,000 |
Source: Public Records
Tax History Compared to Growth
Tax History
| Year | Tax Paid | Tax Assessment Tax Assessment Total Assessment is a certain percentage of the fair market value that is determined by local assessors to be the total taxable value of land and additions on the property. | Land | Improvement |
|---|---|---|---|---|
| 2025 | $5,113 | $434,480 | $217,240 | $217,240 |
| 2024 | $5,113 | $425,962 | $212,981 | $212,981 |
| 2023 | $4,956 | $417,610 | $208,805 | $208,805 |
| 2022 | $4,918 | $409,422 | $204,711 | $204,711 |
| 2021 | $4,849 | $401,396 | $200,698 | $200,698 |
| 2020 | $4,788 | $397,282 | $198,641 | $198,641 |
| 2019 | $4,619 | $389,494 | $194,747 | $194,747 |
| 2018 | $4,524 | $381,858 | $190,929 | $190,929 |
| 2017 | $4,463 | $374,372 | $187,186 | $187,186 |
| 2016 | $4,327 | $367,032 | $183,516 | $183,516 |
| 2015 | $4,134 | $350,000 | $159,000 | $191,000 |
| 2014 | $3,780 | $320,000 | $146,000 | $174,000 |
Source: Public Records
Map
Nearby Homes
- 10337 Strathmore Dr
- 10212 Swanton Dr
- 9307 Dalehurst Rd
- 8894 Trailridge Ave
- 9530 Galston Dr
- 9717 Carita Ct
- 9844 Halberns Blvd
- 9209 Les Rd
- 9468 Wharton Rd
- 9022 Rupp Ct
- 9434 Pike Rd
- 9276 Ruffin Rd
- 9659 Mast Blvd
- 9233 Maranda Dr
- 9336 Carlton Hills Blvd
- 10321 Hitching Post Way Unit 5
- 9542 Nicole Way
- 9404 Carlton Oaks Dr Unit D
- 9867 Via Francis
- 9933 Golden Ln W
- 9233 Fenway Rd
- 10230 Settle Rd
- 9225 Fenway Rd
- 10226 Settle Rd
- 9226 Fenway Rd
- 9221 Fenway Rd
- 9230 Fenway Rd
- 9222 Fenway Rd
- 10304 Settle Rd
- 10235 Settle Rd
- 9219 Fenway Rd
- 10327 Walden Ct
- 10239 Settle Rd
- 9218 Fenway Rd
- 10308 Settle Rd
- 10227 Settle Rd
- 10303 Settle Rd
- 10329 Walden Ct
- 10325 Walden Ct
- 10307 Settle Rd