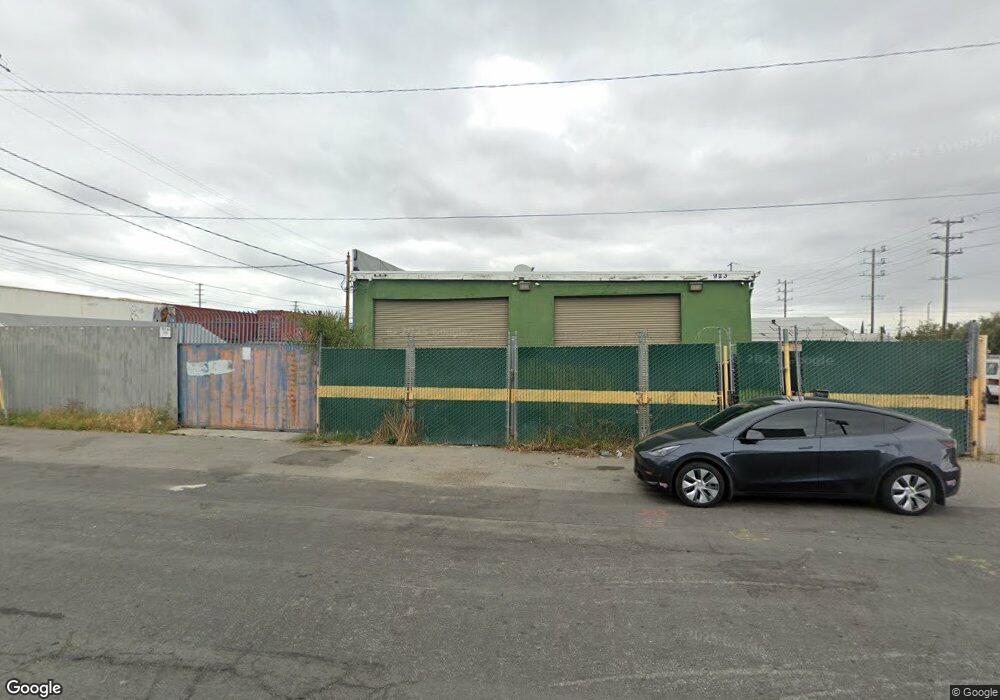
923 E F St Wilmington, CA 90744
Estimated Value: $828,218
Studio
--
Bath
2,774
Sq Ft
$299/Sq Ft
Est. Value
About This Home
This home is located at 923 E F St, Wilmington, CA 90744 and is currently estimated at $828,218, approximately $298 per square foot. 923 E F St is a home located in Los Angeles County with nearby schools including Wilmington Park Elementary, Wilmington Middle School STEAM Magnet, and Phineas Banning Senior High School.
Ownership History
Date
Name
Owned For
Owner Type
Purchase Details
Closed on
Nov 15, 2016
Sold by
Pace Stephen
Bought by
Global Chemical Products Llc
Current Estimated Value
Purchase Details
Closed on
Nov 16, 2012
Sold by
Pace Pamela H
Bought by
Pace Stephen and Pace Pamela H
Purchase Details
Closed on
Jul 24, 2012
Sold by
Pace Stephen
Bought by
Pace Pamela H
Purchase Details
Closed on
Jul 20, 2012
Sold by
Burelli Llc
Bought by
Southwest Hauling Disposal & Demolition
Purchase Details
Closed on
Jul 18, 2012
Sold by
Southwest Hauling Disposal & Demolition
Bought by
Pace Pamela H
Purchase Details
Closed on
Aug 25, 2006
Sold by
Brooks Marline
Bought by
Burelli Llc
Purchase Details
Closed on
Jan 31, 1997
Sold by
Francis D Foley Trust and Michael
Bought by
Brooks Marline
Create a Home Valuation Report for This Property
The Home Valuation Report is an in-depth analysis detailing your home's value as well as a comparison with similar homes in the area
Home Values in the Area
Average Home Value in this Area
Purchase History
| Date | Buyer | Sale Price | Title Company |
|---|---|---|---|
| Global Chemical Products Llc | $480,000 | Fidelity National Title | |
| Pace Stephen | -- | None Available | |
| Pace Pamela H | -- | None Available | |
| Southwest Hauling Disposal & Demolition | -- | None Available | |
| Pace Pamela H | $250,000 | None Available | |
| Burelli Llc | $419,000 | Chicago Title Co | |
| Brooks Marline | -- | -- |
Source: Public Records
Tax History
| Year | Tax Paid | Tax Assessment Tax Assessment Total Assessment is a certain percentage of the fair market value that is determined by local assessors to be the total taxable value of land and additions on the property. | Land | Improvement |
|---|---|---|---|---|
| 2025 | $7,039 | $557,075 | $348,173 | $208,902 |
| 2024 | $7,039 | $546,153 | $341,347 | $204,806 |
| 2023 | $6,909 | $535,445 | $334,654 | $200,791 |
| 2022 | $6,598 | $524,947 | $328,093 | $196,854 |
| 2021 | $6,507 | $514,655 | $321,660 | $192,995 |
| 2019 | $6,318 | $499,392 | $312,120 | $187,272 |
| 2018 | $6,166 | $489,600 | $306,000 | $183,600 |
| 2016 | $3,368 | $260,057 | $156,034 | $104,023 |
| 2015 | $3,322 | $256,152 | $153,691 | $102,461 |
| 2014 | $3,340 | $251,135 | $150,681 | $100,454 |
Source: Public Records
Map
Nearby Homes
- 832 Mcfarland Ave
- 1060 Mcfarland Ave
- 947 Via Camino Unit 11
- 1127 Mcfarland Ave
- 1020 Broad Ave
- 1515 E Young St
- 1138 N Banning Blvd
- 1144 Blinn Ave
- 1339 E M St
- 1422 E Mauretania St
- 1056 N Fries Ave
- 1301 E Pacific Coast Hwy
- 823 Lagoon Ave
- 1437 E Colon St
- 1402 E O St
- 1425 Seagrove Ave
- 703 W Anaheim St
- 1057 N Neptune Ave
- 1520 E Sandison St
- 705 McDonald Ave
Your Personal Tour Guide
Ask me questions while you tour the home.