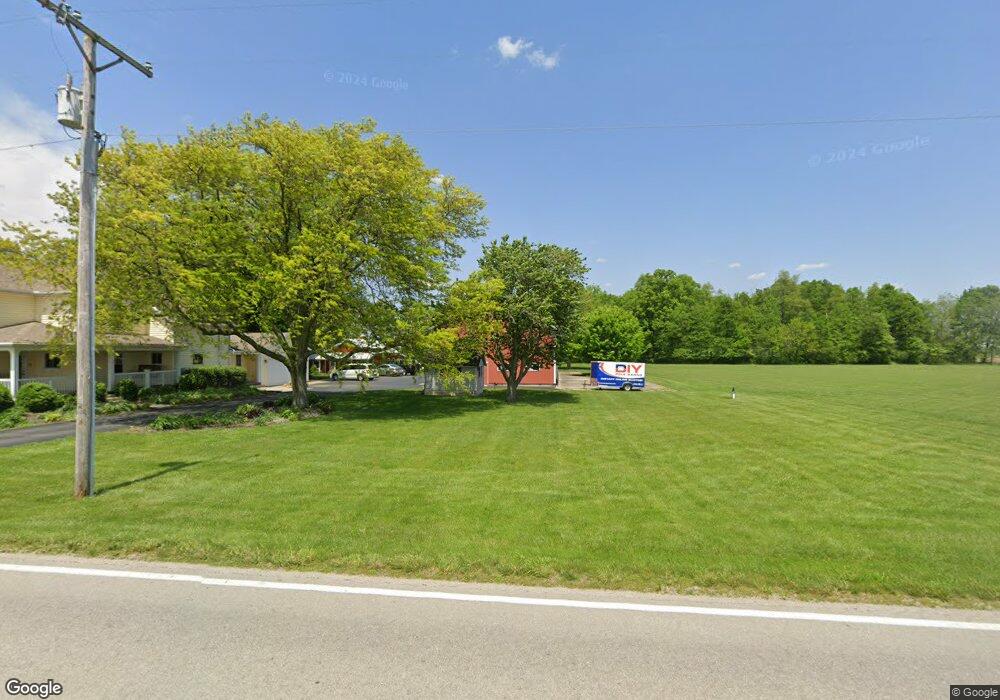
9232 Hogpath Rd Arcanum, OH 45304
Estimated Value: $329,000 - $449,448
3
Beds
2
Baths
2,712
Sq Ft
$151/Sq Ft
Est. Value
About This Home
This home is located at 9232 Hogpath Rd, Arcanum, OH 45304 and is currently estimated at $410,362, approximately $151 per square foot. 9232 Hogpath Rd is a home located in Darke County with nearby schools including Franklin Monroe Elementary School and Franklin Monroe High School.
Ownership History
Date
Name
Owned For
Owner Type
Purchase Details
Closed on
Oct 4, 2017
Sold by
Gilmore Natalie A
Bought by
Gilmore Natalie A and The Natalie A Gilmore Trust
Current Estimated Value
Purchase Details
Closed on
Apr 23, 2012
Sold by
Gilmore Michael W and Gilmore Natalie A
Bought by
Gilmore Natalie A
Home Financials for this Owner
Home Financials are based on the most recent Mortgage that was taken out on this home.
Original Mortgage
$108,500
Outstanding Balance
$45,800
Interest Rate
4.08%
Mortgage Type
Purchase Money Mortgage
Estimated Equity
$364,562
Purchase Details
Closed on
Jun 27, 2008
Sold by
Fisher Jill E and Fisher Wayne A
Bought by
Gilmore Michael W and Gilmore Natalie A
Home Financials for this Owner
Home Financials are based on the most recent Mortgage that was taken out on this home.
Original Mortgage
$199,600
Outstanding Balance
$128,637
Interest Rate
6.05%
Mortgage Type
Purchase Money Mortgage
Estimated Equity
$281,725
Create a Home Valuation Report for This Property
The Home Valuation Report is an in-depth analysis detailing your home's value as well as a comparison with similar homes in the area
Purchase History
| Date | Buyer | Sale Price | Title Company |
|---|---|---|---|
| Gilmore Natalie A | -- | None Available | |
| Gilmore Natalie A | -- | Attorney | |
| Gilmore Michael W | $239,500 | Attorney |
Source: Public Records
Mortgage History
| Date | Status | Borrower | Loan Amount |
|---|---|---|---|
| Open | Gilmore Natalie A | $108,500 | |
| Open | Gilmore Michael W | $199,600 |
Source: Public Records
Tax History
| Year | Tax Paid | Tax Assessment Tax Assessment Total Assessment is a certain percentage of the fair market value that is determined by local assessors to be the total taxable value of land and additions on the property. | Land | Improvement |
|---|---|---|---|---|
| 2024 | $3,586 | $106,370 | $34,380 | $71,990 |
| 2023 | $3,591 | $106,370 | $34,380 | $71,990 |
| 2022 | $3,622 | $93,790 | $30,600 | $63,190 |
| 2021 | $3,654 | $93,790 | $30,600 | $63,190 |
| 2020 | $3,118 | $83,640 | $30,600 | $53,040 |
| 2019 | $2,711 | $75,250 | $29,130 | $46,120 |
| 2018 | $2,739 | $75,250 | $29,130 | $46,120 |
| 2017 | $2,354 | $75,250 | $29,130 | $46,120 |
| 2016 | $2,372 | $70,720 | $24,160 | $46,560 |
| 2015 | $2,372 | $70,720 | $24,160 | $46,560 |
| 2014 | $2,388 | $70,720 | $24,160 | $46,560 |
| 2013 | $2,405 | $66,210 | $23,880 | $42,330 |
Source: Public Records
Map
Nearby Homes
- 0 Delisle Fourman Rd
- 9980 Ohio 718
- 6438 Hahn Rd
- 220 Baker St
- 108 S Jefferson St
- 108 S Jefferson
- 133 Dorwin St
- 122 Auld St
- 111 E Pike St
- 204 S Main St
- 107 Mary St
- 13 Laura Cir
- 11863 Hall Rd
- 3874 S State Route 721
- 130 W Church St
- 105 N Miami Ave
- 160 Wyatt St
- 6350 Arcanum Bears Mill Rd
- 6350 Arcanum Bearsmill Rd
- 530 E Main St
- 9291 Hogpath Rd
- 9123 Hogpath Rd
- 9265 Grove Rd
- 9059 Hogpath Rd
- 9059 Hogpath Rd Unit ROD
- 9438 Hogpath Rd
- 9371 Grove Rd
- 4677 Byreley Rd
- 9461 Hogpath Rd
- 4576 Red River West Grove Rd
- 4741 Red River West Grove Rd
- 4741 Red River West Grove Rd
- 4430 Red River West Grove Rd
- 4489 Red River West Grove Rd
- 4489 Red River-West Grove Rd
- 9508 Hogpath Rd
- 0 Byreley Rd
- 4247 Stump Rd
- 4633 Red River West Grove Rd
- 9530 Hogpath Rd
Your Personal Tour Guide
Ask me questions while you tour the home.