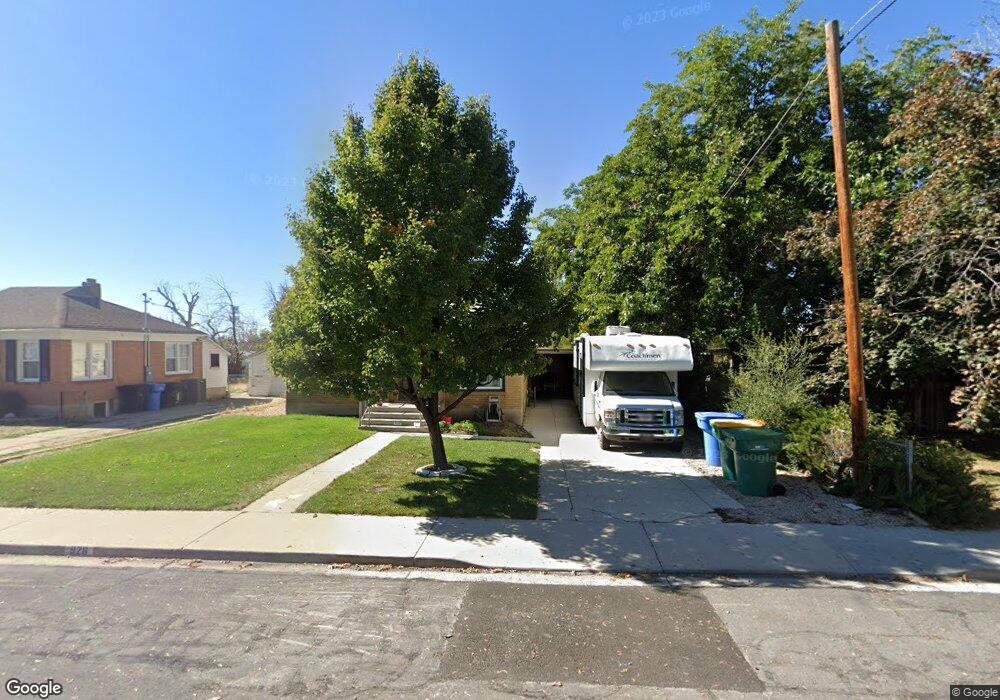
926 S 450 E Orem, UT 84097
Hillcrest NeighborhoodEstimated Value: $433,000 - $515,000
3
Beds
2
Baths
1,709
Sq Ft
$271/Sq Ft
Est. Value
About This Home
This home is located at 926 S 450 E, Orem, UT 84097 and is currently estimated at $463,044, approximately $270 per square foot. 926 S 450 E is a home located in Utah County with nearby schools including Centennial Elementary, Lakeridge Jr High School, and Orem High School.
Ownership History
Date
Name
Owned For
Owner Type
Purchase Details
Closed on
May 31, 2012
Sold by
Larsen Kevin E and Crofts Jennifer L
Bought by
Mccrary Glade P and Mccrary Ashlee R
Current Estimated Value
Home Financials for this Owner
Home Financials are based on the most recent Mortgage that was taken out on this home.
Original Mortgage
$142,373
Outstanding Balance
$98,298
Interest Rate
3.75%
Mortgage Type
FHA
Estimated Equity
$364,746
Purchase Details
Closed on
Jun 10, 2005
Sold by
Hagey James F and Estate Of Jennie Jean Hagey
Bought by
Larsen Kevin E and Crofts Jennifer L
Home Financials for this Owner
Home Financials are based on the most recent Mortgage that was taken out on this home.
Original Mortgage
$133,898
Interest Rate
5.72%
Mortgage Type
FHA
Create a Home Valuation Report for This Property
The Home Valuation Report is an in-depth analysis detailing your home's value as well as a comparison with similar homes in the area
Home Values in the Area
Average Home Value in this Area
Purchase History
| Date | Buyer | Sale Price | Title Company |
|---|---|---|---|
| Mccrary Glade P | -- | Gt Title Services | |
| Larsen Kevin E | -- | Horizon Title Insurance |
Source: Public Records
Mortgage History
| Date | Status | Borrower | Loan Amount |
|---|---|---|---|
| Open | Mccrary Glade P | $142,373 | |
| Previous Owner | Larsen Kevin E | $133,898 |
Source: Public Records
Tax History
| Year | Tax Paid | Tax Assessment Tax Assessment Total Assessment is a certain percentage of the fair market value that is determined by local assessors to be the total taxable value of land and additions on the property. | Land | Improvement |
|---|---|---|---|---|
| 2025 | $1,751 | $213,675 | -- | -- |
| 2024 | $1,751 | $214,115 | $0 | $0 |
| 2023 | $1,633 | $214,555 | $0 | $0 |
| 2022 | $1,608 | $204,710 | $0 | $0 |
| 2021 | $1,440 | $277,700 | $116,600 | $161,100 |
| 2020 | $1,317 | $249,700 | $93,300 | $156,400 |
| 2019 | $1,163 | $229,300 | $93,300 | $136,000 |
| 2018 | $1,088 | $204,900 | $86,600 | $118,300 |
| 2017 | $1,063 | $107,195 | $0 | $0 |
| 2016 | $1,018 | $94,710 | $0 | $0 |
| 2015 | $1,011 | $88,935 | $0 | $0 |
| 2014 | $915 | $80,135 | $0 | $0 |
Source: Public Records
Map
Nearby Homes
Your Personal Tour Guide
Ask me questions while you tour the home.