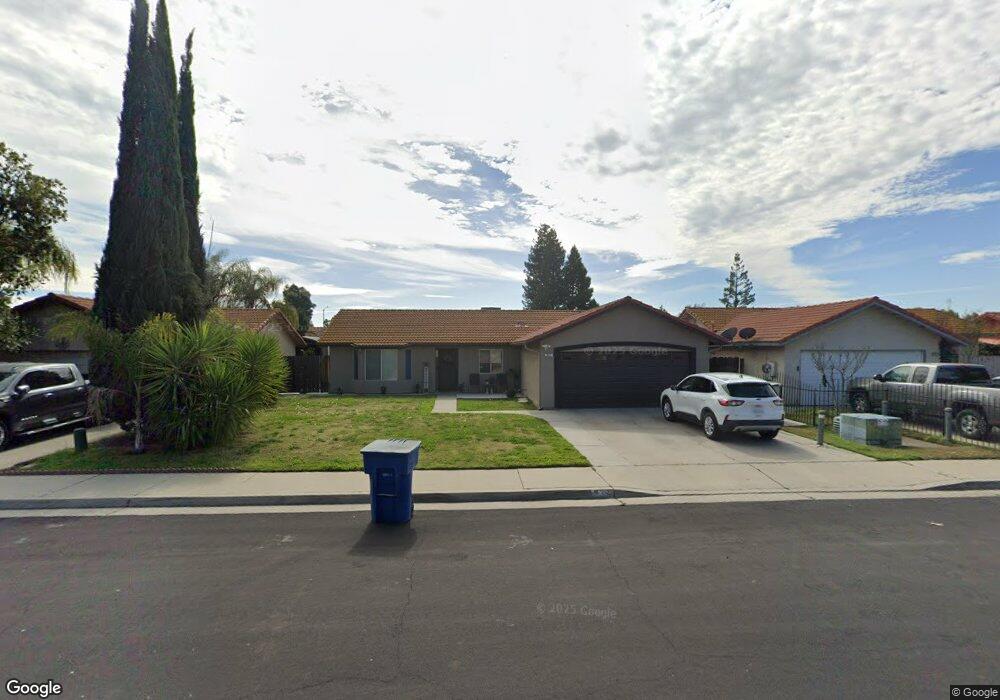
927 2nd St Sanger, CA 93657
Estimated Value: $320,887 - $348,000
3
Beds
2
Baths
1,275
Sq Ft
$264/Sq Ft
Est. Value
About This Home
This home is located at 927 2nd St, Sanger, CA 93657 and is currently estimated at $336,472, approximately $263 per square foot. 927 2nd St is a home located in Fresno County with nearby schools including Wilson Elementary School, Washington Academic Middle School, and Sanger High School.
Ownership History
Date
Name
Owned For
Owner Type
Purchase Details
Closed on
Feb 9, 2007
Sold by
Hurtado Marcello and Hurtado Suzie
Bought by
Hurtado Suzie
Current Estimated Value
Purchase Details
Closed on
Jul 14, 1994
Sold by
Central California Development Inc
Bought by
Hurtado Marcello and Hurtado Suzie
Home Financials for this Owner
Home Financials are based on the most recent Mortgage that was taken out on this home.
Original Mortgage
$85,787
Interest Rate
8.8%
Mortgage Type
FHA
Create a Home Valuation Report for This Property
The Home Valuation Report is an in-depth analysis detailing your home's value as well as a comparison with similar homes in the area
Home Values in the Area
Average Home Value in this Area
Purchase History
| Date | Buyer | Sale Price | Title Company |
|---|---|---|---|
| Hurtado Suzie | -- | None Available | |
| Hurtado Marcello | $86,000 | First American Title Ins Co |
Source: Public Records
Mortgage History
| Date | Status | Borrower | Loan Amount |
|---|---|---|---|
| Closed | Hurtado Marcello | $85,787 |
Source: Public Records
Tax History Compared to Growth
Tax History
| Year | Tax Paid | Tax Assessment Tax Assessment Total Assessment is a certain percentage of the fair market value that is determined by local assessors to be the total taxable value of land and additions on the property. | Land | Improvement |
|---|---|---|---|---|
| 2025 | $1,676 | $145,259 | $50,374 | $94,885 |
| 2023 | $1,653 | $139,620 | $48,419 | $91,201 |
| 2022 | $1,627 | $136,883 | $47,470 | $89,413 |
| 2021 | $1,612 | $134,200 | $46,540 | $87,660 |
| 2020 | $1,564 | $132,825 | $46,063 | $86,762 |
| 2019 | $1,531 | $130,221 | $45,160 | $85,061 |
| 2018 | $1,467 | $127,669 | $44,275 | $83,394 |
| 2017 | $1,440 | $125,166 | $43,407 | $81,759 |
| 2016 | $1,353 | $122,712 | $42,556 | $80,156 |
| 2015 | $1,363 | $120,869 | $41,917 | $78,952 |
| 2014 | $1,343 | $118,502 | $41,096 | $77,406 |
Source: Public Records
Map
Nearby Homes