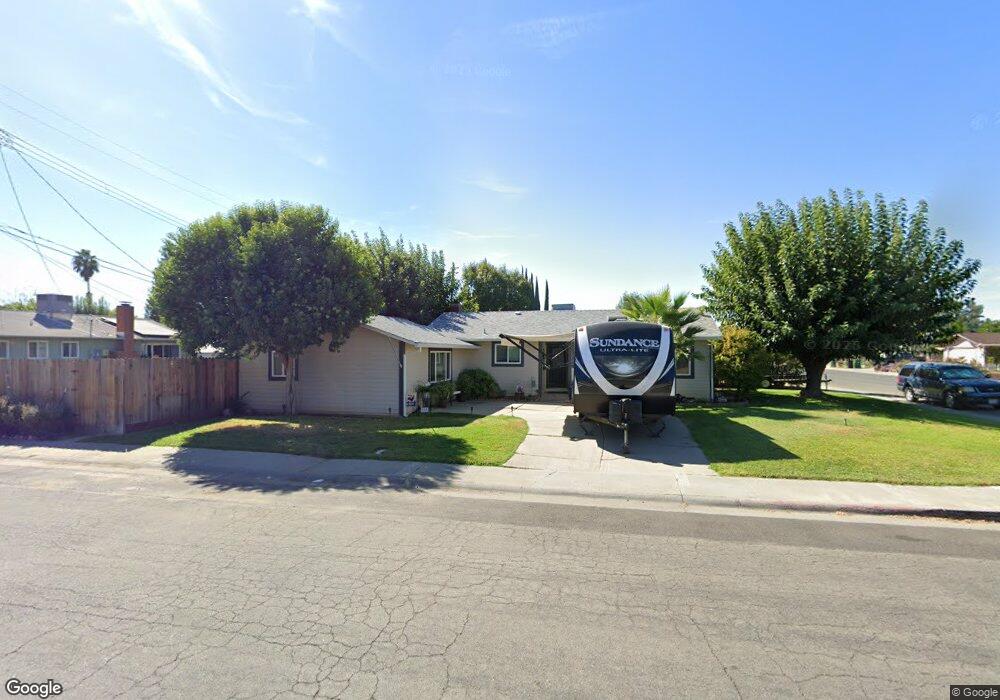
929 N Lassen St Willows, CA 95988
Estimated Value: $299,000 - $342,000
3
Beds
2
Baths
1,594
Sq Ft
$204/Sq Ft
Est. Value
About This Home
This home is located at 929 N Lassen St, Willows, CA 95988 and is currently estimated at $324,923, approximately $203 per square foot. 929 N Lassen St is a home located in Glenn County with nearby schools including Murdock Elementary School, Willows Intermediate School, and Willows High School.
Ownership History
Date
Name
Owned For
Owner Type
Purchase Details
Closed on
Oct 26, 2007
Sold by
Jamke
Bought by
Mitchell Michael F and Mitchell Angela I
Current Estimated Value
Home Financials for this Owner
Home Financials are based on the most recent Mortgage that was taken out on this home.
Original Mortgage
$193,900
Outstanding Balance
$122,111
Interest Rate
6.29%
Mortgage Type
Unknown
Estimated Equity
$202,812
Purchase Details
Closed on
Mar 6, 2006
Sold by
Delpape Wade and Delpape Del Pape
Bought by
Jamke
Purchase Details
Closed on
May 22, 2003
Sold by
Gilbert Nancy A
Bought by
Delpape Wade and Delpape Melany
Home Financials for this Owner
Home Financials are based on the most recent Mortgage that was taken out on this home.
Original Mortgage
$82,500
Interest Rate
7.99%
Mortgage Type
Unknown
Create a Home Valuation Report for This Property
The Home Valuation Report is an in-depth analysis detailing your home's value as well as a comparison with similar homes in the area
Home Values in the Area
Average Home Value in this Area
Purchase History
| Date | Buyer | Sale Price | Title Company |
|---|---|---|---|
| Mitchell Michael F | $194,000 | Old Republic Title Company | |
| Jamke | $185,000 | Glenn County Title Company | |
| Delpape Wade | $129,500 | North State Title Co |
Source: Public Records
Mortgage History
| Date | Status | Borrower | Loan Amount |
|---|---|---|---|
| Open | Mitchell Michael F | $193,900 | |
| Previous Owner | Delpape Wade | $82,500 | |
| Closed | Delpape Wade | $20,000 |
Source: Public Records
Tax History
| Year | Tax Paid | Tax Assessment Tax Assessment Total Assessment is a certain percentage of the fair market value that is determined by local assessors to be the total taxable value of land and additions on the property. | Land | Improvement |
|---|---|---|---|---|
| 2025 | $3,463 | $254,820 | $78,807 | $176,013 |
| 2024 | $3,463 | $249,824 | $77,262 | $172,562 |
| 2023 | $3,358 | $244,927 | $75,748 | $169,179 |
| 2022 | $3,041 | $223,418 | $45,000 | $178,418 |
| 2021 | $2,755 | $203,107 | $40,622 | $162,485 |
| 2020 | $2,477 | $184,643 | $36,929 | $147,714 |
| 2019 | $2,321 | $167,857 | $33,572 | $134,285 |
| 2018 | $2,293 | $167,857 | $33,572 | $134,285 |
| 2017 | $2,227 | $159,863 | $31,973 | $127,890 |
| 2016 | $2,062 | $152,250 | $30,450 | $121,800 |
| 2015 | $1,988 | $145,000 | $29,000 | $116,000 |
| 2014 | $1,916 | $138,000 | $28,000 | $110,000 |
Source: Public Records
Map
Nearby Homes
- 534 Glenwood Ln
- 1015 Green St
- 650 Pacific Ave
- 1041 Washington St
- 1165 Southgate Dr
- 0 5th St
- 421 5th St
- 151 N Shasta St
- 1035 W Walnut St
- 151 S Murdock Ave
- 159 159 S Shasta St
- 159 S Shasta St
- 251 S Lassen St
- 633 E Walnut St
- 440 E Sycamore St
- 145 S Sonoma St
- 266 S Yolo St
- 447 S Marshall Ave
- 446 S Lassen St
- 609 S Lassen St
- 531 Edgewood Ln
- 535 Edgewood Ln
- 540 Glenwood Ln
- 932 N Lassen St
- 926 N Lassen St
- 545 Edgewood Ln
- 529 Glenwood Ln
- 940 N Lassen St
- 515 Glenwood Ln
- 920 N Lassen St
- 535 Glenwood Ln
- 546 Glenwood Ln
- 557 Edgewood Ln Unit 16
- 557 Edgewood Ln
- 850 N Lassen St
- 543 Glenwood Ln
- 528 Edgewood Ln
- 534 Edgewood Ln
- 552 Glenwood Ln
- 565 Edgewood Ln
Your Personal Tour Guide
Ask me questions while you tour the home.