NOT LISTED FOR SALE

929 W Vicki Ave Ridgecrest, CA 93555

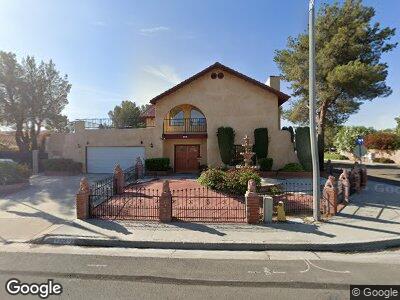
Estimated Value: $436,000 - $470,000

4 Beds
4 Baths
3,147 Sq Ft
$145/Sq Ft Est. Value

Last Sold February 18, 2022

Last sale price $435,000 $138 Per Sq Ft

Est. 5% increase in value since last sale

Current estimated payment $2,997/month

About This Home

As of February 2022

This home is located at 929 W Vicki Ave, Ridgecrest, CA 93555 and is currently estimated at $455,039, approximately $144 per square foot. 929 W Vicki Ave is a home located in Kern County with nearby schools including Las Flores Elementary School, Murray Middle School, and Burroughs High School.

Ownership History

Date Name Owned For Owner Type

Purchase Details

Closed on
Dec 20, 2021
Sold by
Bushnell Irma L
Bought by
Sword Larry W
Current Estimated Value
$455,039

Home Financials for this Owner

Home Financials are based on the most recent Mortgage that was taken out on this home.
Original Mortgage
$421,800
Interest Rate
3.55%
Mortgage Type
VA

Purchase Details

Closed on
Aug 30, 2018
Sold by
Bushnell Irma L and Bushnell Russell Floyd
Bought by
Bushnell Irma L

Range of Values:

Collateral Analytics

Collateral Analytics Collateral Analytics AVMs (Automated Valuation Model) employ a number of statistical approaches combined with neighborhood-specific comparable selection guarantees the most up-to-date and precise valuations.

Not Available

Collateral Analytics does not have data for the current month. Please view the chart for historical values.

ICE

ICE Mortgage Technology ICE Mortgage Technology’s AVM (Automated Valuation Model) is a state-of-the-art online residential property valuation tool that provides a quick and accurate estimate of the value of almost any home in the U.S.

Not Available

ICE Mortgage Technology does not have data for the current month. Please view the chart for historical values.

First American

First American First American Data & Analytics’ next-generation AVM combines unrivaled data assets with a blended ensemble of valuation models to produce highly accurate, reliable valuations you can trust.

Not Available

First American does not have data for the current month. Please view the chart for historical values.

Quantarium

Quantarium Quantarium’s valuation service, repeatedly proven the industry’s most accurate and comprehensive, is supercharged with a self-learning and auto-tuning AI engine that continually becomes smarter and more accurate as it processes daily inputs from the industry’s leading RE data lake.

Not Available

Quantarium does not have data for the current month. Please view the chart for historical values.

Average Value
Not Available
List Price
Sold Price
Create a Home Valuation Report for This Property
The Home Valuation Report is an in-depth analysis detailing your home's value as well as a comparison with similar homes in the area

Home Values in the Area

Source: Public Records

Average Home Value in this Area


Source: Public Records

Purchase History

Date Buyer Sale Price Title Company
Sword Larry W $435,000 Chicago Title
Bushnell Irma L -- None Available
Source: Public Records

Mortgage History

Date Status Borrower Loan Amount
Previous Owner Sword Larry W $421,800
Previous Owner Bushnell Russell F $151,782
Previous Owner Bushnell Russell F $132,479
Previous Owner Bushnell Russell F $108,500
Source: Public Records

Property History

Date Event Price Change Sq Ft Price
02/18/2022 02/18/22 Sold $435,000 -5.4% $138 / Sq Ft
12/07/2021 12/07/21 Pending -- -- --
06/08/2021 06/08/21 For Sale $459,900 -- $146 / Sq Ft

Tax History Compared to Growth

Source: Public Records

Tax History

Year Tax Paid Tax Assessment Tax Assessment Total Assessment is a certain percentage of the fair market value that is determined by local assessors to be the total taxable value of land and additions on the property. Land Improvement
2024 $5,540 $452,574 $52,020 $400,554
2023 $5,370 $443,700 $51,000 $392,700
2022 $3,857 $312,626 $42,084 $270,542
2021 $3,767 $306,497 $41,259 $265,238
2020 $3,767 $303,355 $40,836 $262,519
2019 $3,622 $303,355 $40,836 $262,519
2018 $3,550 $291,577 $39,251 $252,326
2017 $3,537 $285,861 $38,482 $247,379
2016 $3,394 $280,257 $37,728 $242,529
2015 $3,347 $276,048 $37,162 $238,886
2014 $3,164 $270,642 $36,435 $234,207
Source: Public Records

Agents Affiliated with this Home

  • Section Image
See All Agents

Map