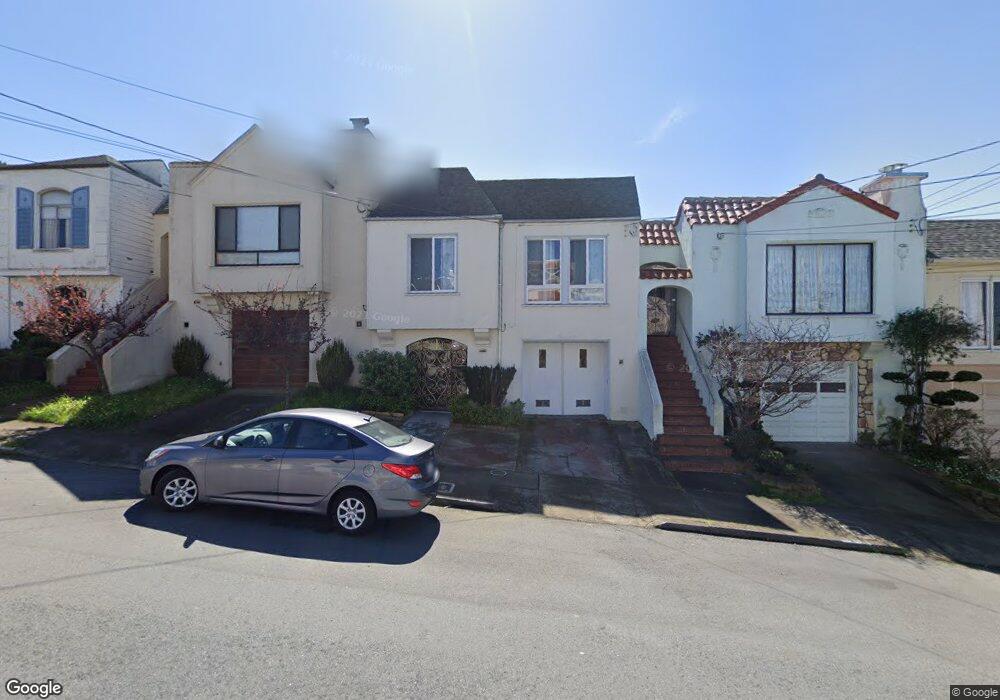
933 Garfield St San Francisco, CA 94132
Merced Heights NeighborhoodEstimated Value: $975,428 - $1,220,000
2
Beds
1
Bath
1,175
Sq Ft
$949/Sq Ft
Est. Value
About This Home
This home is located at 933 Garfield St, San Francisco, CA 94132 and is currently estimated at $1,115,107, approximately $949 per square foot. 933 Garfield St is a home located in San Francisco County with nearby schools including Ortega (Jose) Elementary School, Aptos Middle School, and Krouzian-Zekarian-Vasbouragan Armenian School.
Ownership History
Date
Name
Owned For
Owner Type
Purchase Details
Closed on
Oct 5, 1998
Sold by
Ling Guan Yu
Bought by
Hui Peter Heng and Guan Yu Ling
Current Estimated Value
Home Financials for this Owner
Home Financials are based on the most recent Mortgage that was taken out on this home.
Original Mortgage
$142,000
Outstanding Balance
$30,795
Interest Rate
6.79%
Estimated Equity
$1,084,313
Purchase Details
Closed on
May 17, 1994
Sold by
Luo Heng Hui
Bought by
Guan Yu Ling
Create a Home Valuation Report for This Property
The Home Valuation Report is an in-depth analysis detailing your home's value as well as a comparison with similar homes in the area
Home Values in the Area
Average Home Value in this Area
Purchase History
| Date | Buyer | Sale Price | Title Company |
|---|---|---|---|
| Hui Peter Heng | -- | Chicago Title Co | |
| Guan Yu Ling | -- | -- |
Source: Public Records
Mortgage History
| Date | Status | Borrower | Loan Amount |
|---|---|---|---|
| Open | Hui Peter Heng | $142,000 |
Source: Public Records
Tax History Compared to Growth
Tax History
| Year | Tax Paid | Tax Assessment Tax Assessment Total Assessment is a certain percentage of the fair market value that is determined by local assessors to be the total taxable value of land and additions on the property. | Land | Improvement |
|---|---|---|---|---|
| 2025 | $5,823 | $445,481 | $216,427 | $229,054 |
| 2024 | $5,823 | $436,747 | $212,184 | $224,563 |
| 2023 | $5,726 | $428,184 | $208,024 | $220,160 |
| 2022 | $5,602 | $419,790 | $203,946 | $215,844 |
| 2021 | $5,498 | $411,560 | $199,948 | $211,612 |
| 2020 | $5,538 | $407,341 | $197,898 | $209,443 |
| 2019 | $5,351 | $399,355 | $194,018 | $205,337 |
| 2018 | $5,171 | $391,525 | $190,214 | $201,311 |
| 2017 | $4,810 | $383,849 | $186,485 | $197,364 |
| 2016 | $4,707 | $376,324 | $182,829 | $193,495 |
| 2015 | $4,646 | $370,672 | $180,083 | $190,589 |
| 2014 | $4,524 | $363,412 | $176,556 | $186,856 |
Source: Public Records
Map
Nearby Homes
- 131 Beverly St
- 621 Shields St
- 230 Ralston St
- 531 Arch St
- 424 Garfield St
- 118 Summit Way
- 532 Ramsell St
- 73 Summit Way
- 119 Vernon St
- 233 Sargent St
- 475 Head St
- 442 Bright St
- 150 Chester Ave
- 114 Saint Charles Ave
- 20 Sargent St
- 274 Montana St
- 8100 Oceanview Terrace Unit 112
- 8400 Oceanview Terrace Unit 305
- 2 Westgate Dr
- 337 Jules Ave
- 927 Garfield St
- 921 Garfield St
- 915 Garfield St
- 939 Garfield St
- 178 Beverly St
- 909 Garfield St
- 194 Beverly St
- 279 Monticello St
- 174 Beverly St
- 295 Monticello St
- 275 Monticello St
- 170 Beverly St
- 271 Monticello St
- 166 Beverly St
- 938 Garfield St
- 267 Monticello St
- 200 Beverly St
- 926 Garfield St
- 920 Garfield St
- 162 Beverly St