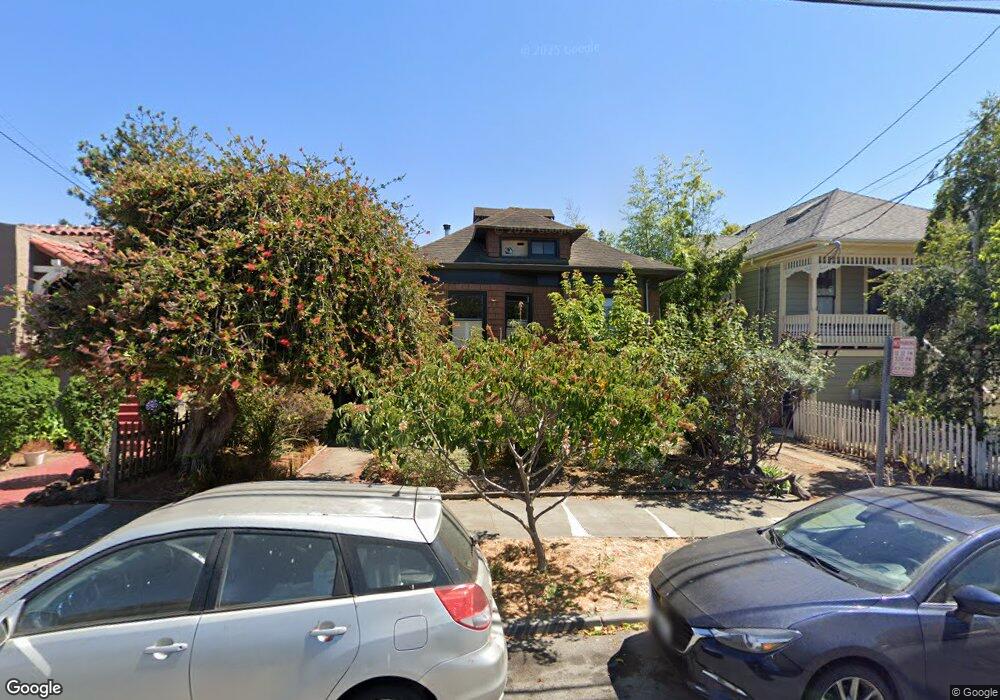
934 Delaware St Berkeley, CA 94710
West Berkeley NeighborhoodEstimated Value: $1,250,000 - $1,404,000
4
Beds
3
Baths
2,277
Sq Ft
$582/Sq Ft
Est. Value
About This Home
This home is located at 934 Delaware St, Berkeley, CA 94710 and is currently estimated at $1,325,791, approximately $582 per square foot. 934 Delaware St is a home located in Alameda County with nearby schools including Rosa Parks Elementary School, Ruth Acty Elementary, and Berkeley Arts Magnet at Whittier School.
Ownership History
Date
Name
Owned For
Owner Type
Purchase Details
Closed on
Jul 10, 2015
Sold by
Chapple Karen D
Bought by
Livi Chapple Karen D and Livi Karen D Chapple Revocable
Current Estimated Value
Purchase Details
Closed on
Dec 28, 2010
Sold by
Chapple Karen D and The Karen D Chapple Revocable
Bought by
Chapple Karen D
Home Financials for this Owner
Home Financials are based on the most recent Mortgage that was taken out on this home.
Original Mortgage
$375,000
Outstanding Balance
$250,349
Interest Rate
4.35%
Mortgage Type
New Conventional
Estimated Equity
$1,075,443
Purchase Details
Closed on
Aug 28, 2007
Sold by
Chapple Karen D
Bought by
Livi Chapple Karen D and Livi Karen D Chapple Revocable
Purchase Details
Closed on
Oct 18, 2001
Sold by
Ooghe Robert and Ooghe Diana
Bought by
Chapple Karen D
Home Financials for this Owner
Home Financials are based on the most recent Mortgage that was taken out on this home.
Original Mortgage
$275,000
Interest Rate
6.87%
Create a Home Valuation Report for This Property
The Home Valuation Report is an in-depth analysis detailing your home's value as well as a comparison with similar homes in the area
Home Values in the Area
Average Home Value in this Area
Purchase History
| Date | Buyer | Sale Price | Title Company |
|---|---|---|---|
| Livi Chapple Karen D | -- | None Available | |
| Chapple Karen D | -- | Old Republic Title Company B | |
| Livi Chapple Karen D | -- | None Available | |
| Chapple Karen D | $460,000 | Placer Title Company |
Source: Public Records
Mortgage History
| Date | Status | Borrower | Loan Amount |
|---|---|---|---|
| Open | Chapple Karen D | $375,000 | |
| Closed | Chapple Karen D | $275,000 |
Source: Public Records
Tax History
| Year | Tax Paid | Tax Assessment Tax Assessment Total Assessment is a certain percentage of the fair market value that is determined by local assessors to be the total taxable value of land and additions on the property. | Land | Improvement |
|---|---|---|---|---|
| 2025 | $12,896 | $717,349 | $203,853 | $520,496 |
| 2024 | $12,896 | $703,149 | $199,857 | $510,292 |
| 2023 | $12,609 | $696,228 | $195,939 | $500,289 |
| 2022 | $12,336 | $675,577 | $192,097 | $490,480 |
| 2021 | $12,337 | $662,195 | $188,331 | $480,864 |
| 2020 | $11,543 | $662,335 | $186,400 | $475,935 |
| 2019 | $10,950 | $649,350 | $182,746 | $466,604 |
| 2018 | $10,738 | $636,621 | $179,164 | $457,457 |
| 2017 | $10,358 | $624,141 | $175,651 | $448,490 |
| 2016 | $9,936 | $611,907 | $172,208 | $439,699 |
| 2015 | $9,790 | $602,718 | $169,622 | $433,096 |
| 2014 | $9,686 | $590,915 | $166,301 | $424,614 |
Source: Public Records
Map
Nearby Homes
- 940 Delaware St
- 995 Virginia St
- 817 Delaware St
- 2013 9th St
- 1128 Delaware St
- 1728 Curtis St
- 1919 Curtis St
- 921 Jones St
- 1050 Allston Way
- 1261 Hearst Ave
- 817 Jones St
- 1631 Belvedere Ave
- 2220 7th St
- 2144 Curtis St
- 2241 Ninth St
- 2238 7th St
- 931 Bancroft Way
- 1322 Virginia St
- 2231 Byron St
- 1450 Fourth St Unit 5
- 932 Delaware St
- 942 Delaware St
- 1810 9th St
- 1809 8th St Unit 1809
- 1811 8th St Unit 1811
- 1802 9th St
- 1812 9th St
- 1813 8th St
- 1814 9th St
- 935 Delaware St
- 1740 9th St Unit 3
- 949 Delaware St Unit 2
- 947 Delaware St
- 941 Delaware St
- 1816 9th St
- 1817 8th St
- 1820 9th St
- 1745 9th St Unit 1745 Ninth Street
- 1000 Delaware St
- 1821 8th St
Your Personal Tour Guide
Ask me questions while you tour the home.