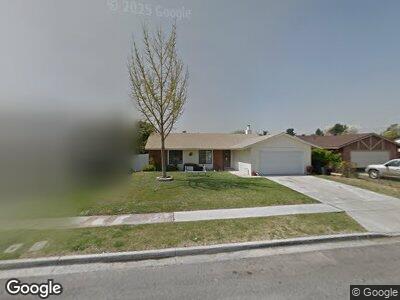
9350 Aspen St Bloomington, CA 92316
Estimated Value: $555,734 - $622,000
3
Beds
2
Baths
1,386
Sq Ft
$422/Sq Ft
Est. Value
About This Home
This home is located at 9350 Aspen St, Bloomington, CA 92316 and is currently estimated at $584,434, approximately $421 per square foot. 9350 Aspen St is a home located in San Bernardino County with nearby schools including Gerald A. Smith Elementary School, Joe Baca, and Bloomington High School.
Ownership History
Date
Name
Owned For
Owner Type
Purchase Details
Closed on
Sep 3, 2003
Sold by
Shumpert Mycol L and Shumpert Terri
Bought by
Mcclain David S and Mcclain Angela M
Current Estimated Value
Home Financials for this Owner
Home Financials are based on the most recent Mortgage that was taken out on this home.
Original Mortgage
$162,400
Interest Rate
7.37%
Mortgage Type
Purchase Money Mortgage
Purchase Details
Closed on
Dec 29, 2000
Sold by
Shumpert Mycol L
Bought by
Shumpert Mycol L and Shumpert Terri
Home Financials for this Owner
Home Financials are based on the most recent Mortgage that was taken out on this home.
Original Mortgage
$118,750
Interest Rate
10.65%
Purchase Details
Closed on
Oct 3, 1995
Sold by
Shumpert Ruby A
Bought by
Shumpert Mycol L
Create a Home Valuation Report for This Property
The Home Valuation Report is an in-depth analysis detailing your home's value as well as a comparison with similar homes in the area
Home Values in the Area
Average Home Value in this Area
Purchase History
| Date | Buyer | Sale Price | Title Company |
|---|---|---|---|
| Mcclain David S | $203,000 | Fidelity National Title | |
| Shumpert Mycol L | -- | South Coast Title | |
| Shumpert Mycol L | -- | -- |
Source: Public Records
Mortgage History
| Date | Status | Borrower | Loan Amount |
|---|---|---|---|
| Open | Mcclain David S | $314,500 | |
| Closed | Mcclain David S | $266,000 | |
| Closed | Mcclain David S | $162,400 | |
| Previous Owner | Shumpert Mycol L | $12,000 | |
| Previous Owner | Shumpert Mycol L | $133,000 | |
| Previous Owner | Shumpert Mycol L | $118,750 | |
| Closed | Mcclain David S | $40,600 |
Source: Public Records
Tax History Compared to Growth
Tax History
| Year | Tax Paid | Tax Assessment Tax Assessment Total Assessment is a certain percentage of the fair market value that is determined by local assessors to be the total taxable value of land and additions on the property. | Land | Improvement |
|---|---|---|---|---|
| 2024 | $4,314 | $282,967 | $69,697 | $213,270 |
| 2023 | $4,590 | $277,418 | $68,330 | $209,088 |
| 2022 | $4,061 | $271,978 | $66,990 | $204,988 |
| 2021 | $4,458 | $266,645 | $65,676 | $200,969 |
| 2020 | $4,486 | $263,911 | $65,003 | $198,908 |
| 2019 | $4,481 | $258,736 | $63,728 | $195,008 |
| 2018 | $4,695 | $253,662 | $62,478 | $191,184 |
| 2017 | $4,299 | $248,688 | $61,253 | $187,435 |
| 2016 | $4,357 | $243,812 | $60,052 | $183,760 |
| 2015 | $4,394 | $230,000 | $80,000 | $150,000 |
| 2014 | $3,858 | $215,000 | $75,000 | $140,000 |
Source: Public Records
Map
Nearby Homes
- 9375 Hollis St
- 872 S Quince Ave
- 1257 W Montrose St
- 961 S Vine Ave
- 806 S Sandalwood Ave
- 720 S Sandalwood Ave
- 9971 Cedar Ave
- 18239 Bonnie Ln
- 18260 Bonnie Ln
- 9842 Magnolia St
- 9050 Dumond Dr
- 18474 Marygold Ave
- 823 W Granada St
- 756 W Fontlee Ln
- 9967 Cedar Ave
- 617 S Arrowhead Ave
- 825 S Brampton Ave
- 687 S Mandarin Ln
- 653 S Mandarin Ln
- 703 W Montrose St