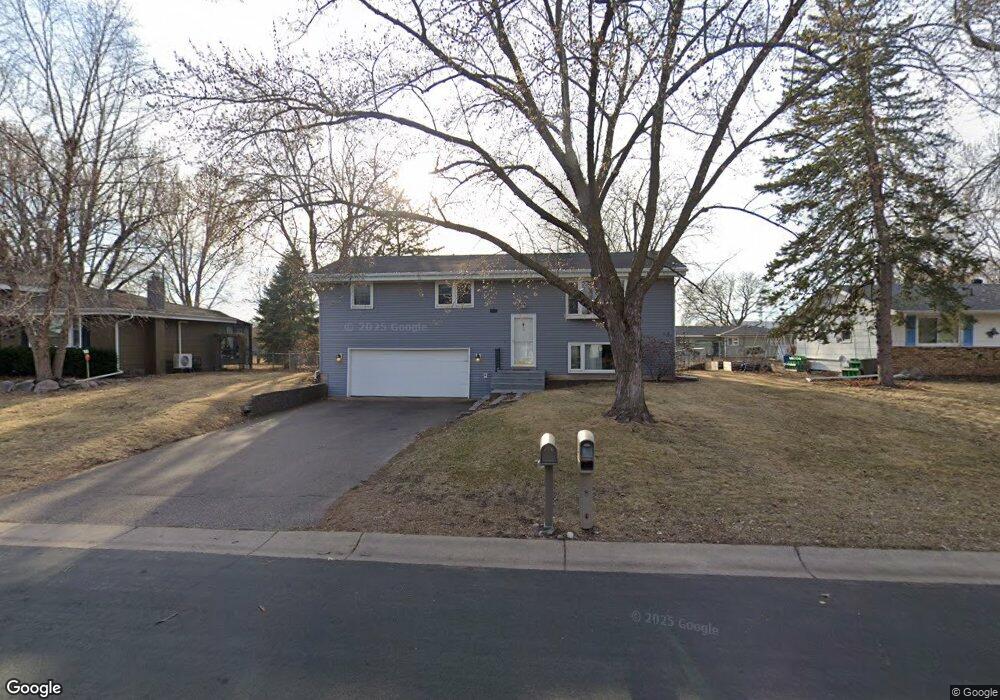
9357 Valley Forge Ln N Maple Grove, MN 55369
Estimated Value: $351,000 - $392,000
3
Beds
2
Baths
1,196
Sq Ft
$316/Sq Ft
Est. Value
About This Home
This home is located at 9357 Valley Forge Ln N, Maple Grove, MN 55369 and is currently estimated at $378,199, approximately $316 per square foot. 9357 Valley Forge Ln N is a home located in Hennepin County with nearby schools including Elm Creek Elementary School, Osseo Middle School, and Osseo Senior High School.
Ownership History
Date
Name
Owned For
Owner Type
Purchase Details
Closed on
Aug 15, 2019
Sold by
Havemeier Mitchell and Oberpriller Albert J
Bought by
Precord Brady Jon and Precord Ashley
Current Estimated Value
Home Financials for this Owner
Home Financials are based on the most recent Mortgage that was taken out on this home.
Original Mortgage
$276,450
Outstanding Balance
$242,119
Interest Rate
3.7%
Mortgage Type
New Conventional
Estimated Equity
$136,080
Purchase Details
Closed on
Sep 29, 2015
Sold by
Hall Jason Q and Hall Stacey L
Bought by
Oberpriller Albert J
Home Financials for this Owner
Home Financials are based on the most recent Mortgage that was taken out on this home.
Original Mortgage
$198,341
Interest Rate
4.12%
Mortgage Type
FHA
Purchase Details
Closed on
Jan 23, 2008
Sold by
Struebing Michael D and Struebing Leah K
Bought by
Hall Jason and Hall Stacey
Purchase Details
Closed on
Aug 20, 1998
Sold by
Mcdeid Richard A and Mcdeid Gretchen K
Bought by
Struebing Michael D and Struebing Leah K
Create a Home Valuation Report for This Property
The Home Valuation Report is an in-depth analysis detailing your home's value as well as a comparison with similar homes in the area
Home Values in the Area
Average Home Value in this Area
Purchase History
| Date | Buyer | Sale Price | Title Company |
|---|---|---|---|
| Precord Brady Jon | $285,000 | Edina Realty Title Inc | |
| Oberpriller Albert J | $202,000 | Trademark Title Services Inc | |
| Hall Jason | $219,900 | -- | |
| Struebing Michael D | $119,300 | -- |
Source: Public Records
Mortgage History
| Date | Status | Borrower | Loan Amount |
|---|---|---|---|
| Open | Precord Brady Jon | $276,450 | |
| Previous Owner | Oberpriller Albert J | $198,341 |
Source: Public Records
Tax History Compared to Growth
Tax History
| Year | Tax Paid | Tax Assessment Tax Assessment Total Assessment is a certain percentage of the fair market value that is determined by local assessors to be the total taxable value of land and additions on the property. | Land | Improvement |
|---|---|---|---|---|
| 2024 | $3,948 | $337,800 | $102,100 | $235,700 |
| 2023 | $3,948 | $342,200 | $96,300 | $245,900 |
| 2022 | $3,384 | $350,600 | $90,000 | $260,600 |
| 2021 | $3,147 | $288,200 | $66,900 | $221,300 |
| 2020 | $3,132 | $265,300 | $50,500 | $214,800 |
| 2019 | $2,872 | $252,800 | $50,500 | $202,300 |
| 2018 | $2,743 | $222,700 | $46,200 | $176,500 |
| 2017 | $2,735 | $202,400 | $46,500 | $155,900 |
| 2016 | $2,680 | $196,500 | $46,500 | $150,000 |
| 2015 | $2,537 | $182,900 | $39,500 | $143,400 |
| 2014 | -- | $163,300 | $34,500 | $128,800 |
Source: Public Records
Map
Nearby Homes
- 6866 Zachary Ln N
- 9501 Revere Ln N
- 10162 93rd Ave N
- 14877 106th Ave N
- 9201 Forestview Ln N
- 9880 Cottonwood Ln N
- 9058 Goldenrod Ln N
- 8864 Cottonwood Ln N
- 8764 Cottonwood Ln N
- 9132 Kirkwood Ln N
- 8704 Cottonwood Ln N
- 9311 Kirkwood Ln N
- 11760 88th Place N
- 9323 Kirkwood Ln N
- 11631 88th Ave N
- 10000 Nathan Ln N
- 9323 Magnolia Ln N
- 225 4th Ave NE
- 12599 91st Place N
- 100 4th Ave SE
- 9343 Valley Forge Ln N
- 9363 Valley Forge Ln N
- 9358 Wellington Ln N
- 9372 Wellington Ln N
- 9346 Wellington Ln N
- 9383 Valley Forge Ln N
- 9358 Valley Forge Ln N
- 9372 Valley Forge Ln N
- 9346 Valley Forge Ln N
- 9332 Wellington Ln N
- 9384 Wellington Ln N
- 9384 Valley Forge Ln N
- 9395 Valley Forge Ln N
- 9315 Valley Forge Ln N
- 9332 Valley Forge Ln N
- 9316 Wellington Ln N
- 9396 Wellington Ln N
- 9396 Valley Forge Ln N
- 9316 Valley Forge Ln N
- 9357 Union Terrace Ln N