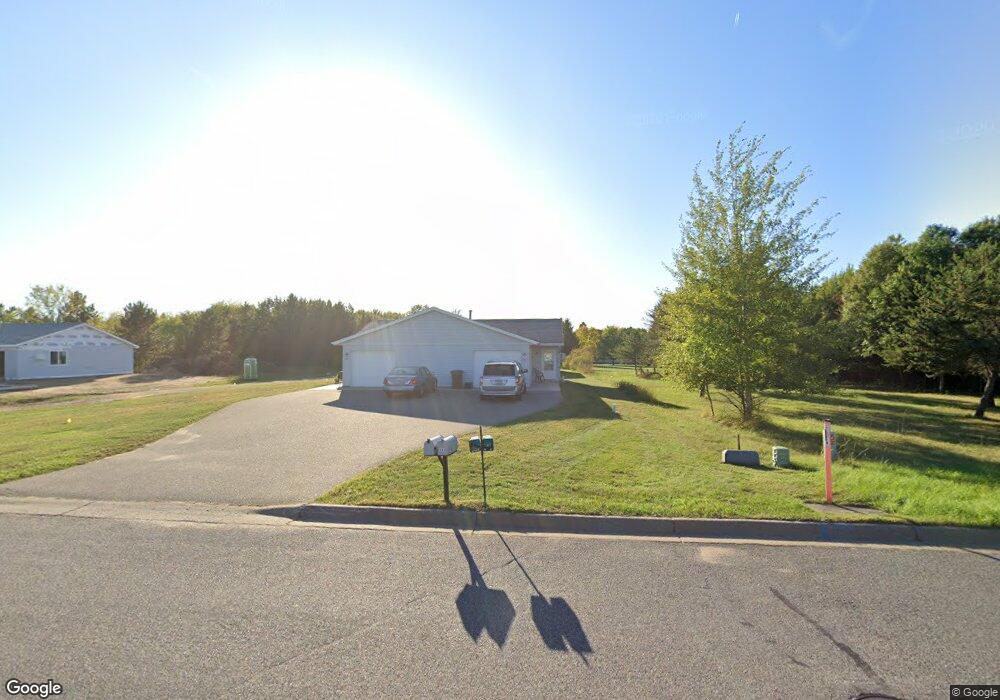
936 28th St SE Brainerd, MN 56401
Estimated Value: $262,950 - $330,000
4
Beds
2
Baths
1,536
Sq Ft
$193/Sq Ft
Est. Value
About This Home
This home is located at 936 28th St SE, Brainerd, MN 56401 and is currently estimated at $295,988, approximately $192 per square foot. 936 28th St SE is a home located in Crow Wing County with nearby schools including Harrison Elementary School, Forestview Middle School, and Brainerd Senior High School.
Ownership History
Date
Name
Owned For
Owner Type
Purchase Details
Closed on
May 10, 2017
Sold by
Krantz Corey Corey
Bought by
Li Xue
Current Estimated Value
Home Financials for this Owner
Home Financials are based on the most recent Mortgage that was taken out on this home.
Original Mortgage
$150,228
Outstanding Balance
$125,070
Interest Rate
4.14%
Estimated Equity
$170,918
Purchase Details
Closed on
Mar 1, 2005
Bought by
Krantz Corey J and Krantz Shana D
Create a Home Valuation Report for This Property
The Home Valuation Report is an in-depth analysis detailing your home's value as well as a comparison with similar homes in the area
Home Values in the Area
Average Home Value in this Area
Purchase History
| Date | Buyer | Sale Price | Title Company |
|---|---|---|---|
| Li Xue | $153,000 | -- | |
| Krantz Corey J | $154,900 | -- |
Source: Public Records
Mortgage History
| Date | Status | Borrower | Loan Amount |
|---|---|---|---|
| Open | Li Xue | $150,228 |
Source: Public Records
Tax History
| Year | Tax Paid | Tax Assessment Tax Assessment Total Assessment is a certain percentage of the fair market value that is determined by local assessors to be the total taxable value of land and additions on the property. | Land | Improvement |
|---|---|---|---|---|
| 2025 | $2,820 | $256,100 | $49,100 | $207,000 |
| 2024 | $2,820 | $263,900 | $49,200 | $214,700 |
| 2023 | $2,966 | $294,000 | $44,900 | $249,100 |
| 2022 | $2,680 | $254,900 | $37,100 | $217,800 |
| 2021 | $2,676 | $186,900 | $32,300 | $154,600 |
| 2020 | $2,516 | $178,500 | $32,900 | $145,600 |
| 2019 | $2,094 | $160,000 | $32,900 | $127,100 |
| 2018 | $1,840 | $153,000 | $32,900 | $120,100 |
| 2017 | $2,594 | $144,500 | $32,900 | $111,600 |
| 2016 | $2,564 | $140,100 | $32,900 | $107,200 |
| 2015 | $2,386 | $131,200 | $27,900 | $103,300 |
| 2014 | $1,350 | $136,700 | $26,600 | $110,100 |
Source: Public Records
Map
Nearby Homes
- 2814 Blair St
- 2814 Addison Ave
- 2821 Clara St
- 2913 Blair St
- 970 York Ct
- 978 York Ct
- 1049 Holton Ave
- 864 Holton Ave
- 949 Holton Ave
- 780 Holton Ave
- 753 Holton Ave
- TBD Oak St
- 3AC Liberty Ln
- 1724 Laurel St
- LOT A Minnesota 18
- 1308 Chicago Ave SE
- 12191 Oakridge Rd
- 1306 Chicago Ave SE
- 414 SE 14th St
- 1314 Norwood St
Your Personal Tour Guide
Ask me questions while you tour the home.