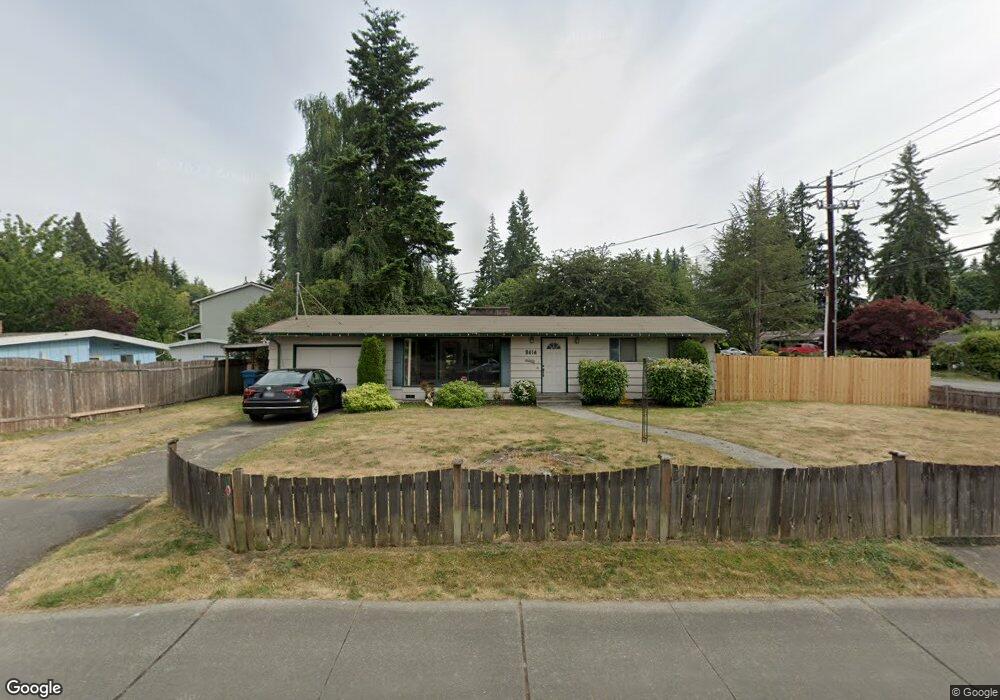
9414 220th St SW Edmonds, WA 98020
Westgate NeighborhoodEstimated Value: $709,302 - $821,000
3
Beds
1
Bath
1,120
Sq Ft
$693/Sq Ft
Est. Value
About This Home
This home is located at 9414 220th St SW, Edmonds, WA 98020 and is currently estimated at $776,576, approximately $693 per square foot. 9414 220th St SW is a home located in Snohomish County with nearby schools including Westgate Elementary School, College Place Middle School, and Edmonds-Woodway High School.
Ownership History
Date
Name
Owned For
Owner Type
Purchase Details
Closed on
Oct 6, 2005
Sold by
Hilt George
Bought by
Ajer Michael and Ajer Kelly A
Current Estimated Value
Home Financials for this Owner
Home Financials are based on the most recent Mortgage that was taken out on this home.
Original Mortgage
$71,500
Interest Rate
9.3%
Mortgage Type
Credit Line Revolving
Purchase Details
Closed on
Nov 16, 2001
Sold by
Sagvold John W and Sagvold Lynette D
Bought by
Hilt George
Home Financials for this Owner
Home Financials are based on the most recent Mortgage that was taken out on this home.
Original Mortgage
$191,592
Interest Rate
6.63%
Mortgage Type
FHA
Purchase Details
Closed on
Jan 25, 1999
Sold by
Sagvold John W
Bought by
Sagvold John W and Sagvold Lynette D
Home Financials for this Owner
Home Financials are based on the most recent Mortgage that was taken out on this home.
Original Mortgage
$90,000
Interest Rate
6.63%
Create a Home Valuation Report for This Property
The Home Valuation Report is an in-depth analysis detailing your home's value as well as a comparison with similar homes in the area
Home Values in the Area
Average Home Value in this Area
Purchase History
| Date | Buyer | Sale Price | Title Company |
|---|---|---|---|
| Ajer Michael | $279,500 | Pnwt | |
| Hilt George | $194,599 | Stewart Title Company | |
| Sagvold John W | -- | -- |
Source: Public Records
Mortgage History
| Date | Status | Borrower | Loan Amount |
|---|---|---|---|
| Closed | Ajer Michael | $71,500 | |
| Open | Ajer Michael | $208,000 | |
| Previous Owner | Hilt George | $191,592 | |
| Previous Owner | Sagvold John W | $90,000 |
Source: Public Records
Tax History Compared to Growth
Tax History
| Year | Tax Paid | Tax Assessment Tax Assessment Total Assessment is a certain percentage of the fair market value that is determined by local assessors to be the total taxable value of land and additions on the property. | Land | Improvement |
|---|---|---|---|---|
| 2025 | $4,551 | $655,300 | $548,200 | $107,100 |
| 2024 | $4,551 | $638,200 | $531,100 | $107,100 |
| 2023 | $4,034 | $586,100 | $467,200 | $118,900 |
| 2022 | $3,967 | $474,000 | $384,200 | $89,800 |
| 2020 | $3,669 | $392,000 | $301,800 | $90,200 |
| 2019 | $3,398 | $365,800 | $277,100 | $88,700 |
| 2018 | $3,390 | $315,400 | $236,300 | $79,100 |
| 2017 | $2,823 | $274,800 | $204,900 | $69,900 |
| 2016 | $2,574 | $248,200 | $181,100 | $67,100 |
| 2015 | $2,643 | $240,000 | $179,500 | $60,500 |
| 2013 | $2,055 | $175,900 | $121,400 | $54,500 |
Source: Public Records
Map
Nearby Homes
- 7522 221st St SW
- 22212 98th Ave W
- 22039 98th Place W
- 21703 97th Ave W
- 1221 Coronado Place
- 9511 Edmonds Way
- 21232 92nd Place W
- 9533 Bowdoin Way
- 23015 Edmonds Way Unit A103
- 22910 90th Ave W Unit C306
- 1021 Walnut St
- 637 Elm Place
- 23024 99th Ave W
- 23121 Edmonds Way Unit 2
- 21505 84th Ave W
- 8825 231st Place SW
- 816 Walnut St
- 23227 92nd Ave W
- 8732 209th Place SW
- 8804 209th Place SW
- 9406 220th St SW
- 22017 95th Place W
- 22012 94th Place W
- 9430 220th St SW
- 9417 220th St SW
- 9320 220th St SW
- 22012 95th Place W
- 9407 220th St SW
- 22027 95th Place W
- 21925 95th Ave W
- 22014 94th Place W
- 9327 220th St SW
- 9415 220th St SW
- 9514 220th St SW
- 22030 95th Place W
- 9413 220th St SW
- 22103 95th Place W
- 22018 94th Place W
- 9310 220th St SW
- 9505 220th St SW