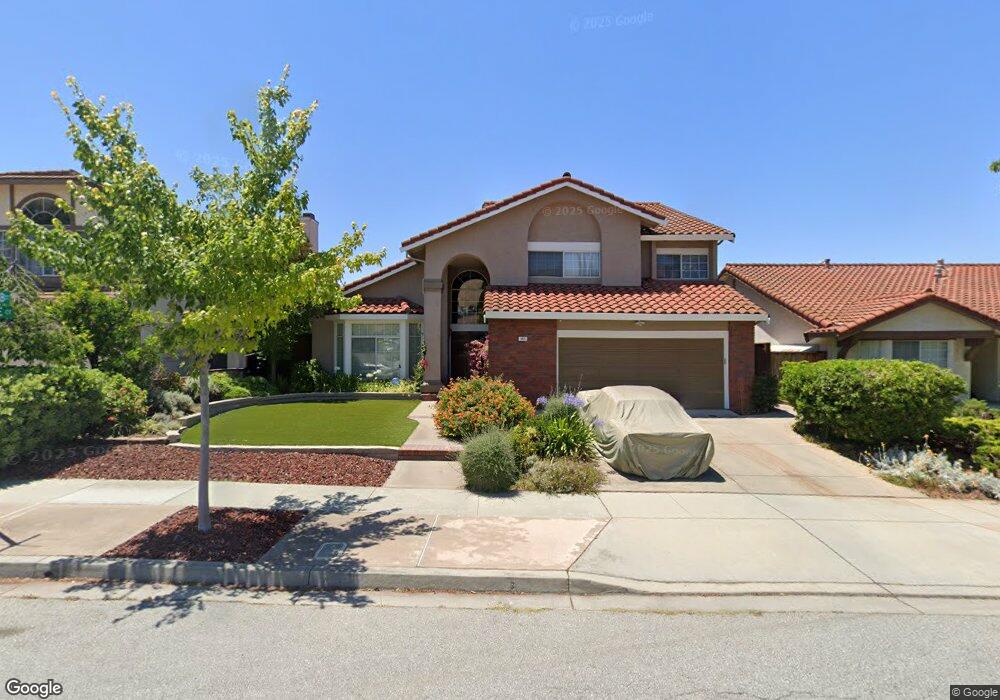
943 Whitcomb Ct Milpitas, CA 95035
Estimated Value: $2,147,000 - $2,805,000
4
Beds
3
Baths
2,705
Sq Ft
$934/Sq Ft
Est. Value
About This Home
This home is located at 943 Whitcomb Ct, Milpitas, CA 95035 and is currently estimated at $2,526,539, approximately $934 per square foot. 943 Whitcomb Ct is a home located in Santa Clara County with nearby schools including John Sinnott Elementary School, Rancho Milpitas Middle School, and Milpitas High School.
Ownership History
Date
Name
Owned For
Owner Type
Purchase Details
Closed on
Apr 5, 2016
Current Estimated Value
Home Financials for this Owner
Home Financials are based on the most recent Mortgage that was taken out on this home.
Original Mortgage
$709,300
Interest Rate
3.37%
Mortgage Type
Adjustable Rate Mortgage/ARM
Purchase Details
Closed on
Mar 29, 2016
Home Financials for this Owner
Home Financials are based on the most recent Mortgage that was taken out on this home.
Original Mortgage
$709,300
Interest Rate
3.37%
Mortgage Type
Adjustable Rate Mortgage/ARM
Purchase Details
Closed on
Aug 26, 2003
Create a Home Valuation Report for This Property
The Home Valuation Report is an in-depth analysis detailing your home's value as well as a comparison with similar homes in the area
Home Values in the Area
Average Home Value in this Area
Purchase History
| Date | Buyer | Sale Price | Title Company |
|---|---|---|---|
| -- | -- | None Available | |
| -- | -- | North American Title Company | |
| -- | -- | -- | |
| -- | -- | -- |
Source: Public Records
Mortgage History
| Date | Status | Borrower | Loan Amount |
|---|---|---|---|
| Closed | -- | $709,300 |
Source: Public Records
Tax History
| Year | Tax Paid | Tax Assessment Tax Assessment Total Assessment is a certain percentage of the fair market value that is determined by local assessors to be the total taxable value of land and additions on the property. | Land | Improvement |
|---|---|---|---|---|
| 2025 | $9,835 | $868,358 | $303,552 | $564,806 |
| 2024 | $9,835 | $851,332 | $297,600 | $553,732 |
| 2023 | $9,887 | $834,640 | $291,765 | $542,875 |
| 2022 | $9,845 | $818,276 | $286,045 | $532,231 |
| 2021 | $9,702 | $802,233 | $280,437 | $521,796 |
| 2020 | $9,532 | $794,008 | $277,562 | $516,446 |
| 2019 | $9,423 | $778,440 | $272,120 | $506,320 |
| 2018 | $8,947 | $763,178 | $266,785 | $496,393 |
| 2017 | $8,830 | $748,214 | $261,554 | $486,660 |
| 2016 | $8,473 | $733,544 | $256,426 | $477,118 |
| 2015 | $8,386 | $722,527 | $252,575 | $469,952 |
| 2014 | $8,162 | $708,375 | $247,628 | $460,747 |
Source: Public Records
Map
Nearby Homes
- 2235 Skyline Dr
- 1621 Tahoe Dr
- 1601 Big Bend Dr
- 2698 Greenrock Rd
- 2178 Ashwood Ln
- 1394 Glacier Dr
- 3312 Birchwood Ln
- 2074 Ashwood Ln
- 2085 Ashwood Ln
- 1260 Glacier Dr
- 3139 Laneview Dr
- 320 Monmouth Dr
- 1787 Canton Dr
- 529 Bryce Ct
- 3278 Sagewood Ln
- 1039 Big Bear Ct
- 397 S Park Victoria Dr
- 3023 Postwood Dr
- 484 Dempsey Rd Unit 186
- 3184 Fernside Square
- 955 Whitcomb Ct
- 931 Whitcomb Ct
- 930 Westridge Dr
- 967 Whitcomb Ct
- 942 Westridge Dr
- 918 Westridge Dr
- 2090 Skyline Dr
- 2078 Skyline Dr
- 2131 Incline Ct
- 2066 Skyline Dr
- 979 Whitcomb Ct
- 2136 Incline Ct
- 954 Westridge Dr
- 2116 Skyline Dr
- 2143 Incline Ct
- 2054 Skyline Dr
- 991 Whitcomb Ct
- 2148 Incline Ct
- 966 Westridge Dr
- 2128 Skyline Dr
Your Personal Tour Guide
Ask me questions while you tour the home.