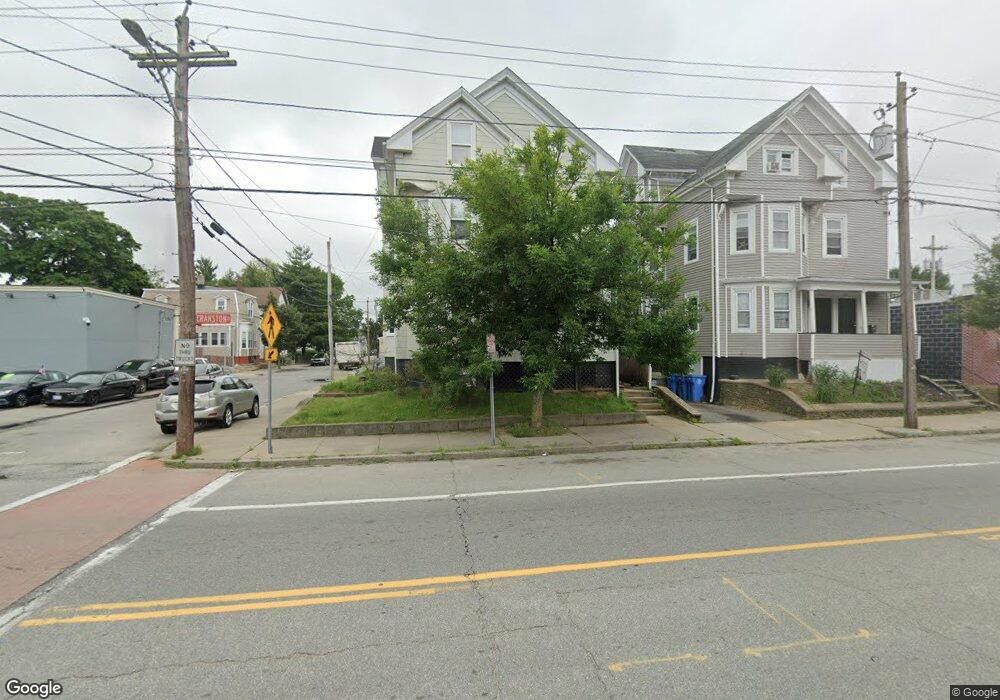
944 Cranston St Cranston, RI 02920
Arlington NeighborhoodEstimated Value: $373,886 - $603,000
7
Beds
3
Baths
4,675
Sq Ft
$109/Sq Ft
Est. Value
About This Home
This home is located at 944 Cranston St, Cranston, RI 02920 and is currently estimated at $510,472, approximately $109 per square foot. 944 Cranston St is a home located in Providence County with nearby schools including Hugh B. Bain Middle School, Cranston High School East, and Achievement First Iluminar Mayoral Academy.
Ownership History
Date
Name
Owned For
Owner Type
Purchase Details
Closed on
Feb 27, 2023
Sold by
Prum Sophorn
Bought by
Prum Sophorn and Prum Vibol
Current Estimated Value
Purchase Details
Closed on
May 9, 2001
Sold by
Disanto Jarod D and Ferranti Kenneth
Bought by
Prum Ben
Home Financials for this Owner
Home Financials are based on the most recent Mortgage that was taken out on this home.
Original Mortgage
$113,950
Interest Rate
6.88%
Mortgage Type
Purchase Money Mortgage
Purchase Details
Closed on
Nov 10, 1999
Sold by
Porcaro Gregory A
Bought by
Disanto Jarod D and Ferranti Kenneth
Home Financials for this Owner
Home Financials are based on the most recent Mortgage that was taken out on this home.
Original Mortgage
$85,500
Interest Rate
7.68%
Mortgage Type
Purchase Money Mortgage
Create a Home Valuation Report for This Property
The Home Valuation Report is an in-depth analysis detailing your home's value as well as a comparison with similar homes in the area
Home Values in the Area
Average Home Value in this Area
Purchase History
| Date | Buyer | Sale Price | Title Company |
|---|---|---|---|
| Prum Sophorn | -- | None Available | |
| Prum Ben | $115,000 | -- | |
| Disanto Jarod D | $95,000 | -- |
Source: Public Records
Mortgage History
| Date | Status | Borrower | Loan Amount |
|---|---|---|---|
| Previous Owner | Disanto Jarod D | $113,950 | |
| Previous Owner | Disanto Jarod D | $85,500 |
Source: Public Records
Tax History Compared to Growth
Tax History
| Year | Tax Paid | Tax Assessment Tax Assessment Total Assessment is a certain percentage of the fair market value that is determined by local assessors to be the total taxable value of land and additions on the property. | Land | Improvement |
|---|---|---|---|---|
| 2025 | $4,930 | $355,200 | $50,700 | $304,500 |
| 2024 | $4,834 | $355,200 | $50,700 | $304,500 |
| 2023 | $3,510 | $185,700 | $15,900 | $169,800 |
| 2022 | $3,437 | $185,700 | $15,900 | $169,800 |
| 2021 | $3,343 | $185,700 | $15,900 | $169,800 |
| 2020 | $3,224 | $155,200 | $15,900 | $139,300 |
| 2019 | $3,224 | $155,200 | $15,900 | $139,300 |
| 2018 | $3,149 | $155,200 | $15,900 | $139,300 |
| 2017 | $2,856 | $124,500 | $15,900 | $108,600 |
| 2016 | $2,795 | $124,500 | $15,900 | $108,600 |
| 2015 | $2,795 | $124,500 | $15,900 | $108,600 |
| 2014 | $2,369 | $103,700 | $15,900 | $87,800 |
Source: Public Records
Map
Nearby Homes
- 17 Birch St
- 16 Ruzzi St
- 121 Heather St
- 63 Lincoln Ave
- 470 Laurel Hill Ave
- 372 Farmington Ave
- 87 Dunedin St
- 121 Hillwood St
- 293 Webster Ave
- 95 Elwyn St
- 127 Gladstone St
- 231 Union Ave
- 454 Union Ave
- 355 Laurel Hill Ave
- 14 Shafter St
- 318 Princess Ave
- 21 Noyes Ave
- 79 Priscilla Ave
- 30 Pomham St
- 0 Princess Ave
- 38 Whipple Ave
- 952 Cranston St
- 36 Whipple Ave
- 41 Bain St Unit 43
- 936 Cranston St
- 37 Whipple Ave
- 37 Bain St
- 33 Whipple Ave
- 0 Bain St
- 30 Whipple Ave
- 957 Cranston St
- 32 Cutting Ave
- 32 Cutting Ave Unit 2
- 33 Bain St
- 64 Whipple Ave
- 30 Cutting Ave
- 962 Cranston St
- 26 Cutting Ave
- 63 Whipple Ave
- 0 Cranston St