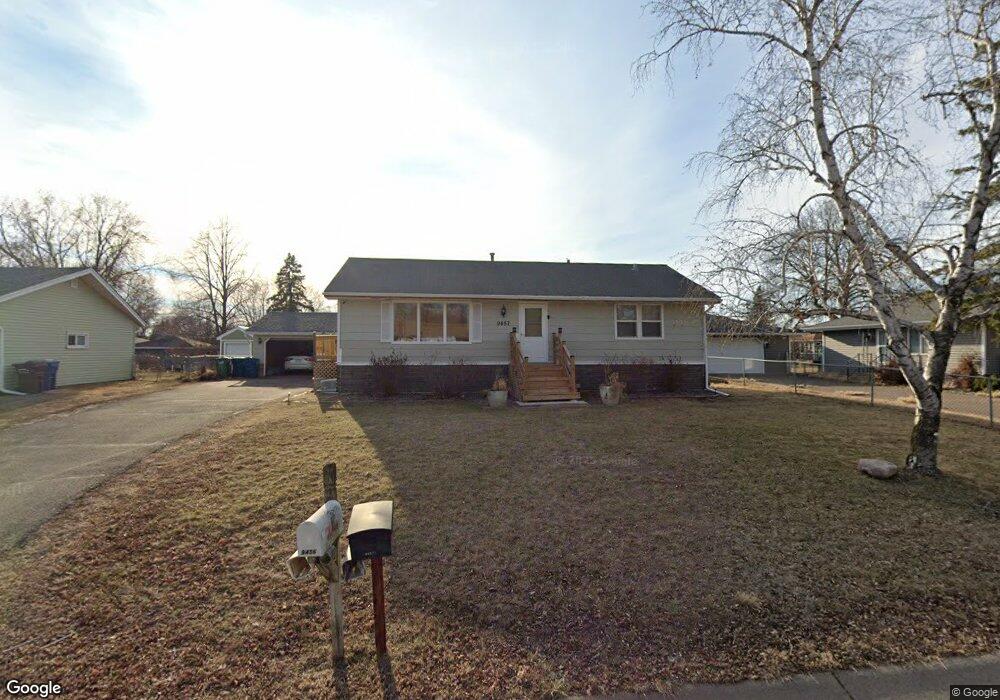
9457 Trenton Ln N Maple Grove, MN 55369
Estimated Value: $336,000 - $379,134
4
Beds
2
Baths
--
Sq Ft
0.25
Acres
About This Home
Property Id: 1364417
This property has recently had multiple upgrades and just getting some great finishing touches. New paint, newer kitchen, new decks and more. The house was recently lifted off the old foundation and raised high ceilings in the newly remodeled basement and second bathroom added downstairs. Two bedrooms on the main level and two bedrooms in the basement! Reach out today to set up a showing time to tour this great space. Small dogs ok, and one cat ok. Fully fenced in back yard. Two car garage has an attached three season room.
Ownership History
Date
Name
Owned For
Owner Type
Purchase Details
Closed on
Feb 5, 2016
Sold by
Forde James D and Forde Luana G
Bought by
Ahmed Christenia and Ahmed Faiz
Current Estimated Value
Home Financials for this Owner
Home Financials are based on the most recent Mortgage that was taken out on this home.
Original Mortgage
$166,250
Outstanding Balance
$132,179
Interest Rate
3.95%
Mortgage Type
New Conventional
Estimated Equity
$218,605
Purchase Details
Closed on
Aug 15, 2003
Sold by
Grohs Construction Inc
Bought by
Forde James and Forde Luaha
Purchase Details
Closed on
Feb 27, 2003
Sold by
Huseby David A and Huseby Teri A
Bought by
Grons Construction Inc
Create a Home Valuation Report for This Property
The Home Valuation Report is an in-depth analysis detailing your home's value as well as a comparison with similar homes in the area
Home Values in the Area
Average Home Value in this Area
Purchase History
| Date | Buyer | Sale Price | Title Company |
|---|---|---|---|
| Ahmed Christenia | $175,000 | Home Title Inc | |
| Forde James | $182,900 | -- | |
| Grons Construction Inc | $135,000 | -- |
Source: Public Records
Mortgage History
| Date | Status | Borrower | Loan Amount |
|---|---|---|---|
| Open | Ahmed Christenia | $166,250 |
Source: Public Records
Property History
| Date | Event | Price | List to Sale | Price per Sq Ft |
|---|---|---|---|---|
| 10/25/2025 10/25/25 | Off Market | $2,795 | -- | -- |
| 10/08/2025 10/08/25 | For Rent | $2,795 | -- | -- |
Tax History Compared to Growth
Tax History
| Year | Tax Paid | Tax Assessment Tax Assessment Total Assessment is a certain percentage of the fair market value that is determined by local assessors to be the total taxable value of land and additions on the property. | Land | Improvement |
|---|---|---|---|---|
| 2024 | $3,746 | $322,300 | $102,100 | $220,200 |
| 2023 | $4,373 | $320,900 | $96,300 | $224,600 |
| 2022 | $3,095 | $323,400 | $90,000 | $233,400 |
| 2021 | $2,804 | $266,100 | $66,900 | $199,200 |
| 2020 | $2,824 | $239,400 | $50,500 | $188,900 |
| 2019 | $2,771 | $230,700 | $50,500 | $180,200 |
| 2018 | $2,361 | $215,800 | $46,200 | $169,600 |
| 2017 | $2,293 | $174,300 | $46,500 | $127,800 |
| 2016 | $2,298 | $172,500 | $46,500 | $126,000 |
| 2015 | $2,210 | $163,000 | $39,500 | $123,500 |
| 2014 | -- | $148,900 | $34,500 | $114,400 |
Source: Public Records
Map
Nearby Homes
- 9501 Revere Ln N
- 10162 93rd Ave N
- 6866 Zachary Ln N
- 14877 106th Ave N
- 9880 Cottonwood Ln N
- 9201 Forestview Ln N
- 10000 Nathan Ln N
- 8864 Cottonwood Ln N
- 9058 Goldenrod Ln N
- 8764 Cottonwood Ln N
- 225 4th Ave NE
- 8704 Cottonwood Ln N
- 9311 Kirkwood Ln N
- 9132 Kirkwood Ln N
- 9323 Kirkwood Ln N
- 11760 88th Place N
- 11631 88th Ave N
- 9323 Magnolia Ln N
- 100 4th Ave SE
- 9667 103rd Place N
- 9463 Trenton Ln N
- 9443 Trenton Ln N
- 9456 Union Terrace Ln N
- 9442 Union Terrace Ln N
- 9462 Union Terrace Ln N
- 9429 Trenton Ln N
- 9481 Trenton Ln N
- 9456 Trenton Ln N
- 9462 Trenton Ln N
- 9442 Trenton Ln N
- 9428 Union Terrace Ln N
- 9480 Union Terrace Ln N
- 9415 Trenton Ln N
- 9428 Trenton Ln N
- 9480 Trenton Ln N
- 9414 Union Terrace Ln N
- 9501 Trenton Ln N
- 9451 Union Terrace Ln N
- 9401 Trenton Ln N
- 9463 Saratoga Ln N