Estimated Value: $82,000 - $120,000
2
Beds
1
Bath
1,001
Sq Ft
$104/Sq Ft
Est. Value
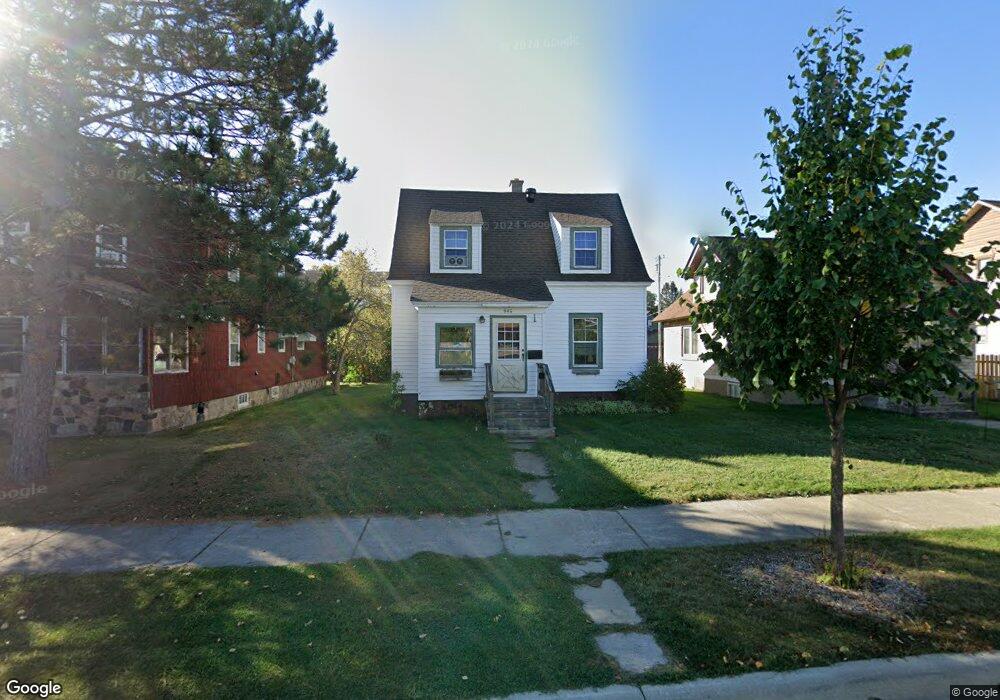
About This Home
This home is located at 946 E Chapman St, Ely, MN 55731 and is currently estimated at $103,854, approximately $103 per square foot. 946 E Chapman St is a home located in St. Louis County with nearby schools including Washington Elementary School and Memorial High School.
Ownership History
Date
Name
Owned For
Owner Type
Purchase Details
Closed on
Oct 27, 2022
Sold by
Loe Michael T
Bought by
Archer Dave and Archer Maria Theresa
Current Estimated Value
Home Financials for this Owner
Home Financials are based on the most recent Mortgage that was taken out on this home.
Original Mortgage
$64,000
Outstanding Balance
$55,128
Interest Rate
5.21%
Mortgage Type
New Conventional
Estimated Equity
$48,726
Purchase Details
Closed on
Sep 11, 2013
Sold by
Loe Michael T
Bought by
Archer Dave and Archer Maria Theresa
Home Financials for this Owner
Home Financials are based on the most recent Mortgage that was taken out on this home.
Original Mortgage
$69,500
Interest Rate
8%
Mortgage Type
Seller Take Back
Purchase Details
Closed on
Aug 13, 2010
Sold by
Reynolds Laura and Loe Laura
Bought by
Loe Michael T and Loe Michael
Purchase Details
Closed on
Jul 15, 2003
Sold by
Deadrick Shane M and Deadrick Lynne M
Bought by
Loe Michael T and Loe Laura
Create a Home Valuation Report for This Property
The Home Valuation Report is an in-depth analysis detailing your home's value as well as a comparison with similar homes in the area
Home Values in the Area
Average Home Value in this Area
Purchase History
| Date | Buyer | Sale Price | Title Company |
|---|---|---|---|
| Archer Dave | $72,000 | Northeast Title Company | |
| Archer Dave | $72,000 | Ne Title | |
| Loe Michael T | -- | Northeast Title Company | |
| Loe Michael T | $134,000 | -- |
Source: Public Records
Mortgage History
| Date | Status | Borrower | Loan Amount |
|---|---|---|---|
| Open | Archer Dave | $64,000 | |
| Previous Owner | Archer Dave | $69,500 |
Source: Public Records
Tax History
| Year | Tax Paid | Tax Assessment Tax Assessment Total Assessment is a certain percentage of the fair market value that is determined by local assessors to be the total taxable value of land and additions on the property. | Land | Improvement |
|---|---|---|---|---|
| 2024 | $384 | $78,600 | $6,800 | $71,800 |
| 2023 | $384 | $74,500 | $6,600 | $67,900 |
| 2022 | $546 | $79,300 | $6,300 | $73,000 |
| 2021 | $552 | $66,500 | $5,700 | $60,800 |
| 2020 | $470 | $59,500 | $5,700 | $53,800 |
| 2019 | $434 | $59,500 | $5,700 | $53,800 |
| 2018 | $310 | $58,600 | $5,700 | $52,900 |
| 2017 | $322 | $48,200 | $5,600 | $42,600 |
| 2016 | $338 | $46,500 | $5,100 | $41,400 |
| 2015 | $315 | $28,900 | $3,400 | $25,500 |
| 2014 | $315 | $28,900 | $3,400 | $25,500 |
Source: Public Records
Map
Nearby Homes
- 1135 E Harvey St
- 738 E Camp St
- 628 E Sheridan St
- 246 N 5th Ave E
- 1239 E Washington St
- 324 S 4th Ave E
- 235 E Harvey St
- 545 E Wilson St
- 27 E Harvey St
- 23 W Harvey St
- TBD Hill Top Rd
- TBD Trezona Rd
- 1317 N Pioneer Rd
- 1471 N Pioneer Rd
- 52 W Chandler St
- 1621 N Pioneer Rd
- 2221 Sibley Dr
- 2231 Sibley Dr
- 1530 N 20th Ave E
- TBD Johnson Creek Dr
- 940 E Chapman St
- 952 E Chapman St
- 932 E Chapman St
- 924 E Chapman St
- 945 E Harvey St
- 955 E Harvey St
- 1004 E Chapman St
- 931 E Harvey St
- 925 E Harvey St
- 945 E Chapman St
- 955 E Chapman St
- 1012 E Chapman St
- 1003 E Harvey St
- 935 E Chapman St
- 915 E Harvey St
- 1635 E Harvey St
- 1120 E Harvey St
- XXX E Harvey St
- 1011 E Harvey St
- 919 E Chapman St
Your Personal Tour Guide
Ask me questions while you tour the home.