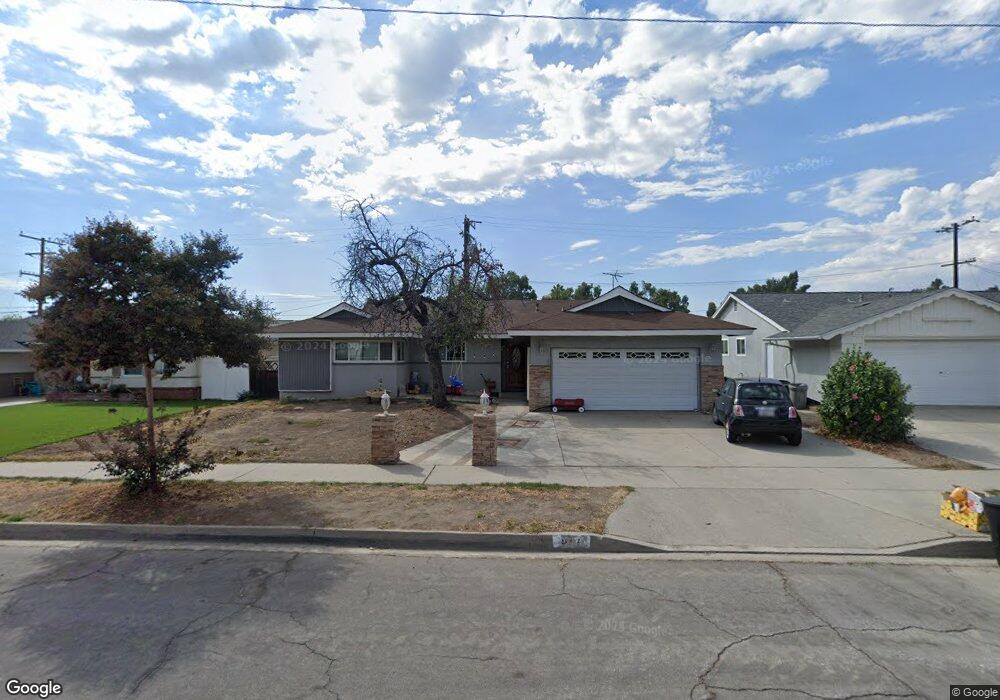
947 Fuchsia Ave Glendora, CA 91740
South Glendora NeighborhoodEstimated Value: $825,000 - $885,000
4
Beds
2
Baths
1,751
Sq Ft
$490/Sq Ft
Est. Value
About This Home
This home is located at 947 Fuchsia Ave, Glendora, CA 91740 and is currently estimated at $857,145, approximately $489 per square foot. 947 Fuchsia Ave is a home located in Los Angeles County with nearby schools including Stanton Elementary School, Sandburg Middle School, and Glendora High School.
Ownership History
Date
Name
Owned For
Owner Type
Purchase Details
Closed on
Mar 17, 2017
Sold by
Hincy William Ryan
Bought by
Hincy William Ryan and Hy Hincy Claire
Current Estimated Value
Home Financials for this Owner
Home Financials are based on the most recent Mortgage that was taken out on this home.
Original Mortgage
$425,671
Outstanding Balance
$351,944
Interest Rate
4.15%
Mortgage Type
FHA
Estimated Equity
$505,201
Purchase Details
Closed on
Jun 11, 2011
Sold by
Luk Mario Chi Fung
Bought by
Hincy William Ryan
Purchase Details
Closed on
Aug 30, 2010
Sold by
Federal National Mortgage Association
Bought by
Hincy William Ryan and Luk Mario Chi Fung
Home Financials for this Owner
Home Financials are based on the most recent Mortgage that was taken out on this home.
Original Mortgage
$353,953
Interest Rate
4.52%
Mortgage Type
New Conventional
Purchase Details
Closed on
Mar 8, 2010
Sold by
Franks Robert D and Franks Teri
Bought by
Federal National Mortgage Association
Create a Home Valuation Report for This Property
The Home Valuation Report is an in-depth analysis detailing your home's value as well as a comparison with similar homes in the area
Home Values in the Area
Average Home Value in this Area
Purchase History
| Date | Buyer | Sale Price | Title Company |
|---|---|---|---|
| Hincy William Ryan | -- | Pacific Coast Title | |
| Hincy William Ryan | -- | Accommodation | |
| Hincy William Ryan | $365,000 | Lawyers Title Company | |
| Federal National Mortgage Association | $380,344 | First American Title Ins Co |
Source: Public Records
Mortgage History
| Date | Status | Borrower | Loan Amount |
|---|---|---|---|
| Open | Hincy William Ryan | $425,671 | |
| Previous Owner | Hincy William Ryan | $353,953 |
Source: Public Records
Tax History Compared to Growth
Tax History
| Year | Tax Paid | Tax Assessment Tax Assessment Total Assessment is a certain percentage of the fair market value that is determined by local assessors to be the total taxable value of land and additions on the property. | Land | Improvement |
|---|---|---|---|---|
| 2025 | $6,005 | $461,146 | $320,735 | $140,411 |
| 2024 | $5,723 | $452,105 | $314,447 | $137,658 |
| 2023 | $5,594 | $443,241 | $308,282 | $134,959 |
| 2022 | $5,487 | $434,551 | $302,238 | $132,313 |
| 2021 | $5,387 | $426,031 | $296,312 | $129,719 |
| 2020 | $5,212 | $421,663 | $293,274 | $128,389 |
| 2019 | $5,093 | $413,396 | $287,524 | $125,872 |
| 2018 | $4,937 | $405,291 | $281,887 | $123,404 |
| 2016 | $4,730 | $389,555 | $270,942 | $118,613 |
| 2015 | $4,626 | $383,705 | $266,873 | $116,832 |
| 2014 | $4,615 | $376,190 | $261,646 | $114,544 |
Source: Public Records
Map
Nearby Homes
- 950 Forestdale Ave
- 125 W Ronwood St
- 205 W Linfield St
- 1030 S Danehurst Ave
- 755 W Citrus Edge St
- 644 W Gaillard St
- 715 Forestdale Ave
- 422 W Route 66 Unit 100
- 946 S Glendora Ave
- 1065 S Prospero Dr
- 337 W Route 66
- 337 W Route 66 Unit 58
- 1401 S Grand Ave
- 149 Rosalynn Dr
- 6138 N Traymore Ave
- 19003 E Haltern Ave
- 330 W Payson St
- 1630 41 S Barranca Avenue Spc 41
- 619 W Leeside St
- 509 W Heber St
- 953 Fuchsia Ave
- 941 Fuchsia Ave
- 935 Fuchsia Ave
- 959 Fuchsia Ave
- 950 Fuchsia Ave
- 944 Fuchsia Ave
- 956 Fuchsia Ave
- 938 Fuchsia Ave
- 929 Fuchsia Ave
- 965 Fuchsia Ave
- 962 Fuchsia Ave
- 412 W Primrose Place
- 949 Bryant Cir
- 923 Fuchsia Ave
- 959 Bryant Cir
- 926 Fuchsia Ave
- 406 W Primrose Place
- 920 Fuchsia Ave
- 917 Fuchsia Ave
- 409 W Primrose Place