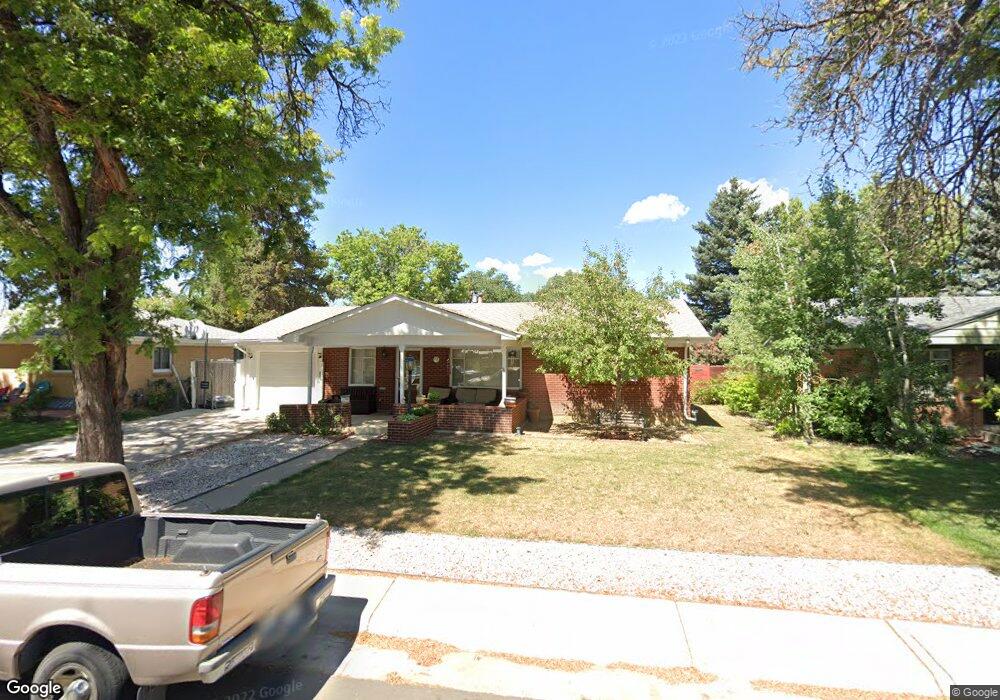
947 Iola St Aurora, CO 80010
Del Mar Parkway NeighborhoodEstimated Value: $396,510 - $440,000
3
Beds
2
Baths
1,120
Sq Ft
$372/Sq Ft
Est. Value
About This Home
This home is located at 947 Iola St, Aurora, CO 80010 and is currently estimated at $417,128, approximately $372 per square foot. 947 Iola St is a home located in Arapahoe County with nearby schools including Fulton Elementary School, North Middle School Health Sciences & Technology, and Aurora Central High School.
Ownership History
Date
Name
Owned For
Owner Type
Purchase Details
Closed on
Jul 25, 1997
Sold by
Wilson Georgia C and Mcmillen Mary Lou
Bought by
Balbona Luis G and Balbona Everia
Current Estimated Value
Home Financials for this Owner
Home Financials are based on the most recent Mortgage that was taken out on this home.
Original Mortgage
$94,240
Outstanding Balance
$12,004
Interest Rate
7.72%
Mortgage Type
FHA
Estimated Equity
$405,124
Purchase Details
Closed on
Jul 27, 1988
Sold by
Conversion Arapco
Bought by
Wilson Georgia C and Mcmillen Mary Lou
Purchase Details
Closed on
Oct 1, 1984
Sold by
Conversion Arapco
Bought by
Conversion Arapco
Purchase Details
Closed on
Oct 1, 1982
Sold by
Conversion Arapco
Bought by
Conversion Arapco
Purchase Details
Closed on
Jul 4, 1776
Bought by
Conversion Arapco
Create a Home Valuation Report for This Property
The Home Valuation Report is an in-depth analysis detailing your home's value as well as a comparison with similar homes in the area
Home Values in the Area
Average Home Value in this Area
Purchase History
| Date | Buyer | Sale Price | Title Company |
|---|---|---|---|
| Balbona Luis G | $94,950 | Land Title | |
| Wilson Georgia C | -- | -- | |
| Conversion Arapco | -- | -- | |
| Conversion Arapco | -- | -- | |
| Conversion Arapco | -- | -- |
Source: Public Records
Mortgage History
| Date | Status | Borrower | Loan Amount |
|---|---|---|---|
| Open | Balbona Luis G | $94,240 | |
| Closed | Balbona Luis G | $2,000 |
Source: Public Records
Tax History
| Year | Tax Paid | Tax Assessment Tax Assessment Total Assessment is a certain percentage of the fair market value that is determined by local assessors to be the total taxable value of land and additions on the property. | Land | Improvement |
|---|---|---|---|---|
| 2025 | $2,607 | $27,094 | -- | -- |
| 2024 | $2,529 | $27,209 | -- | -- |
| 2023 | $2,529 | $27,209 | $0 | $0 |
| 2022 | $2,398 | $23,880 | $0 | $0 |
| 2021 | $2,475 | $23,880 | $0 | $0 |
| 2020 | $2,256 | $21,665 | $0 | $0 |
| 2019 | $2,244 | $21,665 | $0 | $0 |
| 2018 | $2,156 | $20,390 | $0 | $0 |
| 2017 | $1,876 | $20,390 | $0 | $0 |
| 2016 | $1,410 | $15,005 | $0 | $0 |
| 2015 | $1,361 | $15,005 | $0 | $0 |
| 2014 | $945 | $10,038 | $0 | $0 |
| 2013 | -- | $10,350 | $0 | $0 |
Source: Public Records
Map
Nearby Homes
- 885 Ironton St
- 950 Jamaica St
- 1090 Hanover St
- 924 Galena St
- 775 Joliet St
- 840 Kingston St
- 1200 Iola St
- 820 Lansing St
- 10633 E 6th Place
- 736 Fulton St
- 745 Lima St
- 1095 Kramer Ct
- 1025 Lansing St
- 561 Geneva St Unit 103
- 1303 Havana St
- 1170 Kingston St
- 765 Moline St
- 11408 E 7th Ave
- 740 Moline St
- 1341 Jamaica St
Your Personal Tour Guide
Ask me questions while you tour the home.