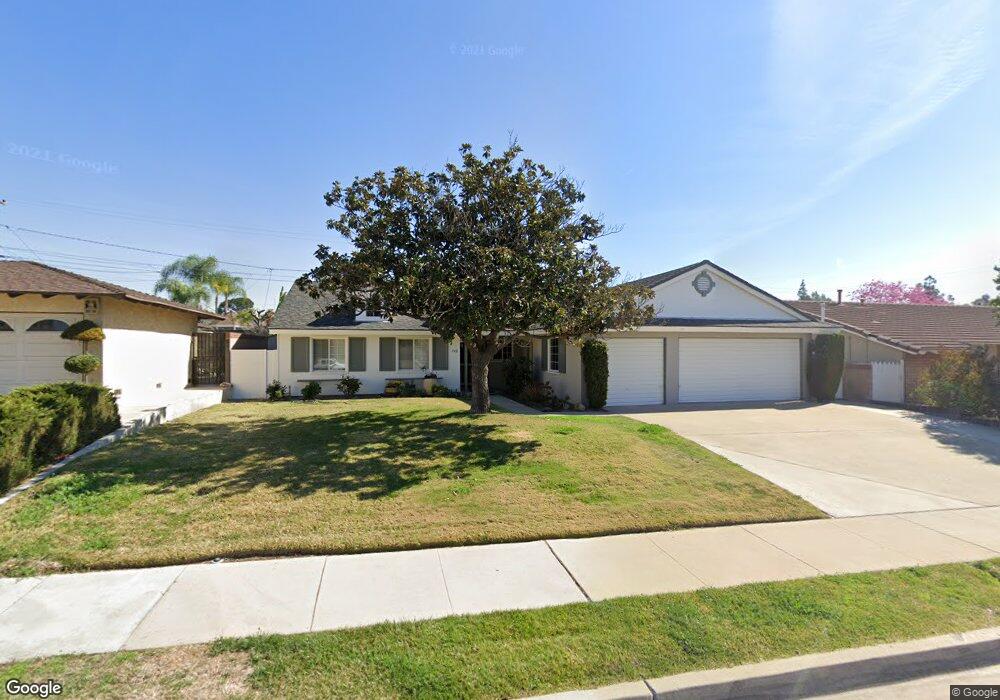
948 Inverness Ave Glendora, CA 91740
South Glendora NeighborhoodEstimated Value: $837,679 - $1,092,000
3
Beds
2
Baths
1,536
Sq Ft
$620/Sq Ft
Est. Value
About This Home
This home is located at 948 Inverness Ave, Glendora, CA 91740 and is currently estimated at $951,920, approximately $619 per square foot. 948 Inverness Ave is a home located in Los Angeles County with nearby schools including Sutherland Elementary School, Goddard Middle School, and Glendora High School.
Ownership History
Date
Name
Owned For
Owner Type
Purchase Details
Closed on
Sep 4, 2019
Sold by
Wilkins Kevin D and Wilkins Janet L
Bought by
Wilkins Kevin D and Wilkins Janet L
Current Estimated Value
Create a Home Valuation Report for This Property
The Home Valuation Report is an in-depth analysis detailing your home's value as well as a comparison with similar homes in the area
Home Values in the Area
Average Home Value in this Area
Purchase History
| Date | Buyer | Sale Price | Title Company |
|---|---|---|---|
| Wilkins Kevin D | -- | None Available |
Source: Public Records
Tax History Compared to Growth
Tax History
| Year | Tax Paid | Tax Assessment Tax Assessment Total Assessment is a certain percentage of the fair market value that is determined by local assessors to be the total taxable value of land and additions on the property. | Land | Improvement |
|---|---|---|---|---|
| 2025 | $3,904 | $296,118 | $112,144 | $183,974 |
| 2024 | $3,904 | $290,313 | $109,946 | $180,367 |
| 2023 | $3,817 | $284,622 | $107,791 | $176,831 |
| 2022 | $3,744 | $279,042 | $105,678 | $173,364 |
| 2021 | $3,672 | $273,571 | $103,606 | $169,965 |
| 2020 | $3,558 | $270,767 | $102,544 | $168,223 |
| 2019 | $3,479 | $265,459 | $100,534 | $164,925 |
| 2018 | $3,347 | $260,255 | $98,563 | $161,692 |
| 2016 | $3,203 | $250,151 | $94,737 | $155,414 |
| 2015 | $3,136 | $246,394 | $93,314 | $153,080 |
| 2014 | $3,134 | $241,569 | $91,487 | $150,082 |
Source: Public Records
Map
Nearby Homes
- 911 Groveton Ave
- 846 Glengrove Ave
- 830 Tressy Ave
- 2022 E Route 66
- 2010 E Route 66
- 1714 E Linfield St
- 2556 Charford St
- 1302 Sierra View Dr
- 2225 Saratoga Ln
- 649 W Gladstone St
- 1255 Bonnie Glen Ln
- 411 Heatherglen Ln
- 1287 Whisperglen Ln
- 1150 W Juanita Ave
- 100 Rawlinsdale Ln
- 409 W 4th St
- 1137 Willow Ave
- 2271 Redwood Dr
- 1138 Las Colinas Way
- 109 Glengrove Ave
- 940 Inverness Ave
- 956 Inverness Ave
- 955 Chippendale Ave
- 947 Chippendale Ave
- 932 Inverness Ave
- 939 Chippendale Ave
- 949 Inverness Ave
- 955 Inverness Ave
- 941 Inverness Ave
- 931 Chippendale Ave
- 924 Inverness Ave
- 2118 E Baseline Rd
- 2124 E Baseline Rd
- 2112 E Baseline Rd
- 933 Inverness Ave
- 2106 E Baseline Rd
- 2130 E Baseline Rd
- 923 Chippendale Ave
- 2100 E Baseline Rd
- 952 Chippendale Ave