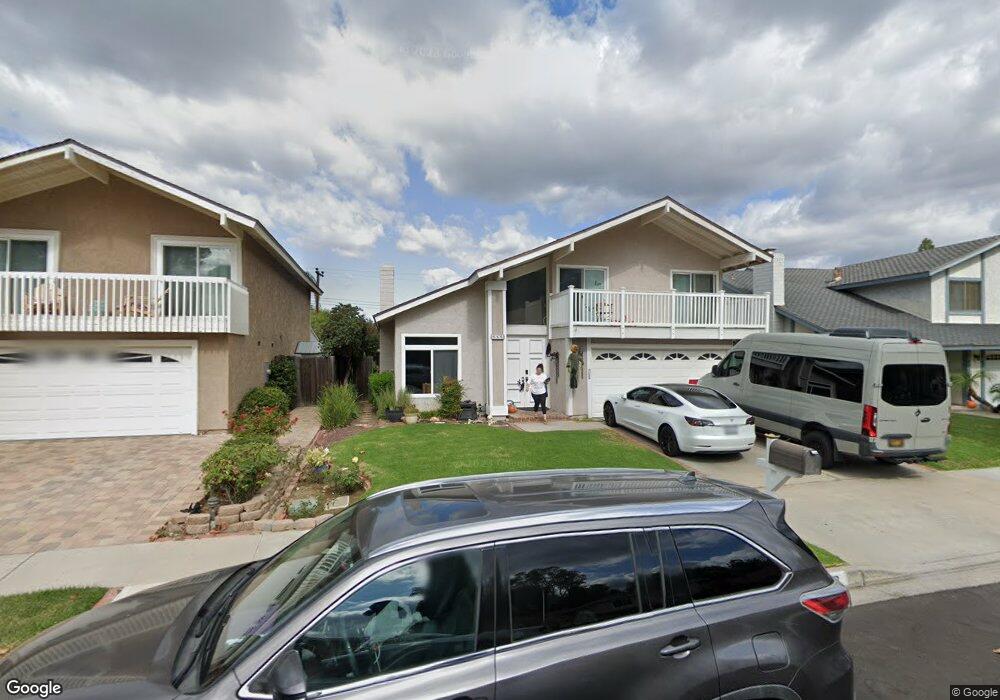
949 Catlin St Simi Valley, CA 93065
West Simi Valley NeighborhoodEstimated Value: $816,858 - $986,000
4
Beds
3
Baths
2,140
Sq Ft
$435/Sq Ft
Est. Value
About This Home
This home is located at 949 Catlin St, Simi Valley, CA 93065 and is currently estimated at $929,965, approximately $434 per square foot. 949 Catlin St is a home located in Ventura County with nearby schools including Madera Elementary School, Sinaloa Middle School, and Royal High School.
Ownership History
Date
Name
Owned For
Owner Type
Purchase Details
Closed on
May 14, 2015
Sold by
Nelson Sharon L and Enderson Linda
Bought by
Nelson Sharon L
Current Estimated Value
Purchase Details
Closed on
Nov 22, 2000
Sold by
Nelson Sharon L
Bought by
Nelson Sharon L and Enderson Linda
Purchase Details
Closed on
Sep 1, 2000
Sold by
Toussaint Lee J and Toussaint Mary S
Bought by
Nelson Sharon L
Home Financials for this Owner
Home Financials are based on the most recent Mortgage that was taken out on this home.
Original Mortgage
$229,500
Interest Rate
7.88%
Purchase Details
Closed on
Nov 11, 1997
Sold by
Lee Balvert Elise L M Trust
Bought by
Toussaint Lee J and Toussaint Mary S
Home Financials for this Owner
Home Financials are based on the most recent Mortgage that was taken out on this home.
Original Mortgage
$151,600
Interest Rate
5.87%
Create a Home Valuation Report for This Property
The Home Valuation Report is an in-depth analysis detailing your home's value as well as a comparison with similar homes in the area
Home Values in the Area
Average Home Value in this Area
Purchase History
| Date | Buyer | Sale Price | Title Company |
|---|---|---|---|
| Nelson Sharon L | -- | Accommodation | |
| Nelson Sharon L | -- | Lawyers Title Company | |
| Nelson Sharon L | $255,000 | Fidelity National Title Ins | |
| Toussaint Lee J | $189,500 | Fidelity National Title |
Source: Public Records
Mortgage History
| Date | Status | Borrower | Loan Amount |
|---|---|---|---|
| Previous Owner | Nelson Sharon L | $229,500 | |
| Previous Owner | Toussaint Lee J | $151,600 |
Source: Public Records
Tax History
| Year | Tax Paid | Tax Assessment Tax Assessment Total Assessment is a certain percentage of the fair market value that is determined by local assessors to be the total taxable value of land and additions on the property. | Land | Improvement |
|---|---|---|---|---|
| 2025 | $4,918 | $384,219 | $153,688 | $230,531 |
| 2024 | $4,918 | $376,686 | $150,675 | $226,011 |
| 2023 | $4,623 | $369,300 | $147,720 | $221,580 |
| 2022 | $4,596 | $362,059 | $144,823 | $217,236 |
| 2021 | $4,554 | $354,960 | $141,983 | $212,977 |
| 2020 | $4,453 | $351,323 | $140,528 | $210,795 |
| 2019 | $4,250 | $344,435 | $137,773 | $206,662 |
| 2018 | $4,209 | $337,682 | $135,072 | $202,610 |
| 2017 | $4,111 | $331,062 | $132,424 | $198,638 |
| 2016 | $3,925 | $324,572 | $129,828 | $194,744 |
| 2015 | $3,838 | $319,699 | $127,879 | $191,820 |
| 2014 | -- | $313,438 | $125,375 | $188,063 |
Source: Public Records
Map
Nearby Homes
- 1148 Bryson Ave
- 1103 Catlin St Unit B
- 1041 Balsamo Ave
- 1165 Fitzgerald Rd Unit G
- 1114 Catlin St Unit A
- 889 Lindamere Ct
- 786 Royal Ave
- 1335 El Monte Dr
- 748 Azure Hills Dr
- 1507 4th St
- 459 Mark Dr
- 1459 Willowbrook Ln
- 1529 Paul St
- 938 Ventura Ave
- 683 Languid Ln
- 922 Carefree Dr
- 952 Carefree Dr
- 1766 Sinaloa Rd Unit 177
- 1766 Sinaloa Rd Unit 282
- 1772 Sinaloa Rd Unit 189
Your Personal Tour Guide
Ask me questions while you tour the home.