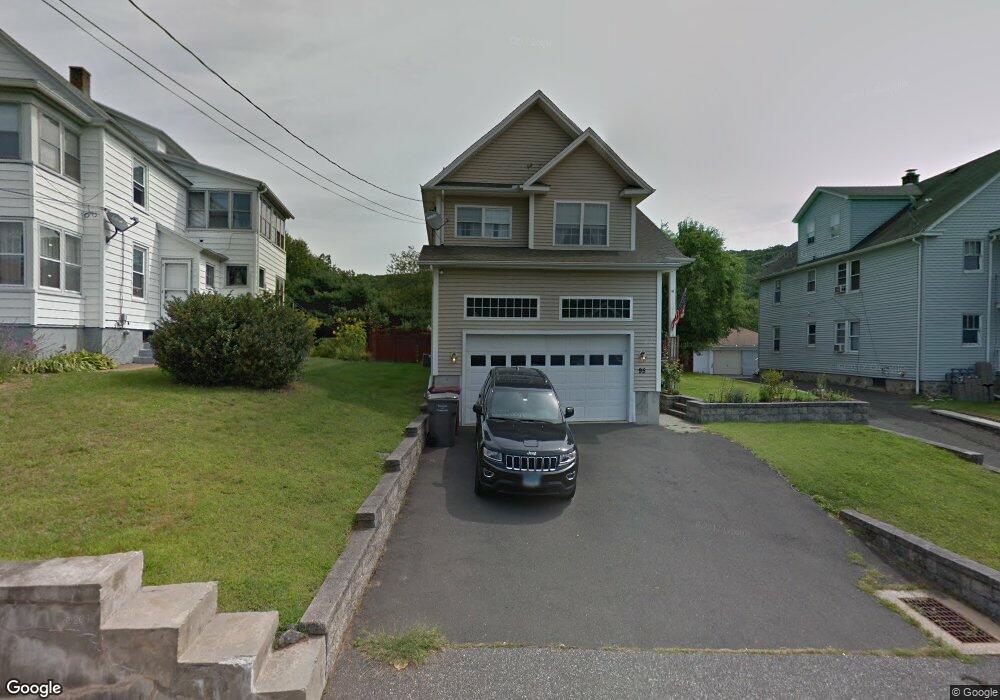
95 High St Naugatuck, CT 06770
Estimated Value: $388,000 - $462,000
3
Beds
3
Baths
1,996
Sq Ft
$217/Sq Ft
Est. Value
About This Home
This home is located at 95 High St, Naugatuck, CT 06770 and is currently estimated at $433,593, approximately $217 per square foot. 95 High St is a home located in New Haven County with nearby schools including City Hill Middle School and Naugatuck High School.
Ownership History
Date
Name
Owned For
Owner Type
Purchase Details
Closed on
Jul 7, 2006
Sold by
Marchetti Dennis and Marchetti Pamela
Bought by
Crooks Jennifer
Current Estimated Value
Home Financials for this Owner
Home Financials are based on the most recent Mortgage that was taken out on this home.
Original Mortgage
$287,100
Outstanding Balance
$139,319
Interest Rate
3.5%
Mortgage Type
Purchase Money Mortgage
Estimated Equity
$294,274
Purchase Details
Closed on
Feb 18, 2004
Sold by
Montero Walter M
Bought by
Adams Ryan D and Adams Jennifer L
Home Financials for this Owner
Home Financials are based on the most recent Mortgage that was taken out on this home.
Original Mortgage
$147,250
Interest Rate
5.83%
Mortgage Type
Purchase Money Mortgage
Purchase Details
Closed on
Nov 13, 2001
Sold by
Donovan William and Donovan Kathleen
Bought by
Montero Walter
Create a Home Valuation Report for This Property
The Home Valuation Report is an in-depth analysis detailing your home's value as well as a comparison with similar homes in the area
Home Values in the Area
Average Home Value in this Area
Purchase History
| Date | Buyer | Sale Price | Title Company |
|---|---|---|---|
| Crooks Jennifer | $319,000 | -- | |
| Adams Ryan D | $63,000 | -- | |
| Montero Walter | $27,500 | -- |
Source: Public Records
Mortgage History
| Date | Status | Borrower | Loan Amount |
|---|---|---|---|
| Open | Montero Walter | $287,100 | |
| Previous Owner | Montero Walter | $147,250 |
Source: Public Records
Tax History Compared to Growth
Tax History
| Year | Tax Paid | Tax Assessment Tax Assessment Total Assessment is a certain percentage of the fair market value that is determined by local assessors to be the total taxable value of land and additions on the property. | Land | Improvement |
|---|---|---|---|---|
| 2025 | $9,626 | $241,920 | $30,380 | $211,540 |
| 2024 | $10,110 | $241,920 | $30,380 | $211,540 |
| 2023 | $10,826 | $241,920 | $30,380 | $211,540 |
| 2022 | $7,911 | $165,680 | $32,580 | $133,100 |
| 2021 | $7,911 | $165,680 | $32,580 | $133,100 |
| 2020 | $7,911 | $165,680 | $32,580 | $133,100 |
| 2019 | $7,828 | $165,680 | $32,580 | $133,100 |
| 2018 | $7,466 | $154,410 | $39,190 | $115,220 |
| 2017 | $7,497 | $154,410 | $39,190 | $115,220 |
| 2016 | $7,361 | $154,410 | $39,190 | $115,220 |
| 2015 | $7,036 | $154,410 | $39,190 | $115,220 |
| 2014 | $6,958 | $154,410 | $39,190 | $115,220 |
| 2012 | $7,330 | $218,490 | $49,490 | $169,000 |
Source: Public Records
Map
Nearby Homes