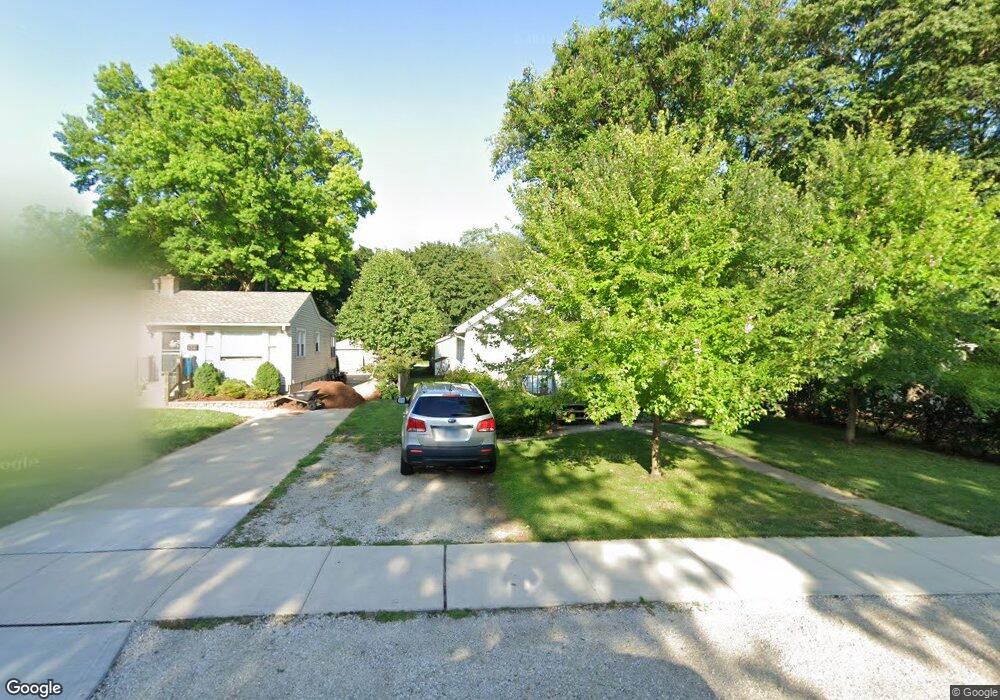
950 N Sleight St Naperville, IL 60563
North Naperville NeighborhoodEstimated Value: $344,000 - $381,898
--
Bed
--
Bath
1,142
Sq Ft
$317/Sq Ft
Est. Value
About This Home
This home is located at 950 N Sleight St, Naperville, IL 60563 and is currently estimated at $361,975, approximately $316 per square foot. 950 N Sleight St is a home located in DuPage County with nearby schools including Nature Ridge Elementary School, Beebe Elementary School, and Jefferson Jr High School.
Ownership History
Date
Name
Owned For
Owner Type
Purchase Details
Closed on
Feb 25, 2025
Sold by
Dkdc Properties Llc
Bought by
Weinreis Alex Taylor and Weinreis Cheryl Lee
Current Estimated Value
Home Financials for this Owner
Home Financials are based on the most recent Mortgage that was taken out on this home.
Original Mortgage
$301,500
Outstanding Balance
$299,920
Interest Rate
6.75%
Mortgage Type
New Conventional
Estimated Equity
$62,055
Purchase Details
Closed on
Nov 21, 2011
Sold by
Camp David A and Camp Kathleen D
Bought by
Dkdc Properties Llc
Purchase Details
Closed on
Jan 19, 1999
Sold by
Federal National Mortgage Association
Bought by
Camp David A and Camp Kathleen D
Home Financials for this Owner
Home Financials are based on the most recent Mortgage that was taken out on this home.
Original Mortgage
$96,000
Interest Rate
6.75%
Mortgage Type
Purchase Money Mortgage
Create a Home Valuation Report for This Property
The Home Valuation Report is an in-depth analysis detailing your home's value as well as a comparison with similar homes in the area
Home Values in the Area
Average Home Value in this Area
Purchase History
| Date | Buyer | Sale Price | Title Company |
|---|---|---|---|
| Weinreis Alex Taylor | $335,000 | Chicago Title | |
| Dkdc Properties Llc | -- | None Available | |
| Camp David A | -- | -- |
Source: Public Records
Mortgage History
| Date | Status | Borrower | Loan Amount |
|---|---|---|---|
| Open | Weinreis Alex Taylor | $301,500 | |
| Previous Owner | Camp David A | $96,000 |
Source: Public Records
Tax History Compared to Growth
Tax History
| Year | Tax Paid | Tax Assessment Tax Assessment Total Assessment is a certain percentage of the fair market value that is determined by local assessors to be the total taxable value of land and additions on the property. | Land | Improvement |
|---|---|---|---|---|
| 2024 | $7,363 | $120,188 | $82,682 | $37,506 |
| 2023 | $7,128 | $109,690 | $75,460 | $34,230 |
| 2022 | $6,454 | $99,720 | $68,600 | $31,120 |
| 2021 | $6,228 | $95,950 | $66,010 | $29,940 |
| 2020 | $6,100 | $94,220 | $64,820 | $29,400 |
| 2019 | $5,934 | $90,150 | $62,020 | $28,130 |
| 2018 | $6,248 | $94,890 | $65,280 | $29,610 |
| 2017 | $6,132 | $91,690 | $63,080 | $28,610 |
| 2016 | $6,020 | $88,380 | $60,800 | $27,580 |
| 2015 | $6,000 | $83,230 | $57,260 | $25,970 |
| 2014 | $5,789 | $77,780 | $53,510 | $24,270 |
| 2013 | $5,702 | $77,970 | $53,640 | $24,330 |
Source: Public Records
Map
Nearby Homes
- 930 N Loomis St
- 837 N Loomis St
- 959 N Brainard St
- 26W250 Case St
- 719 N Brainard St
- 717 N Brainard St
- 715 N Brainard St
- 1142 N Webster St
- 636 E 4th Ave
- 904 Coletta Cir
- 5S365 Vest Ave
- 1528 Shenandoah Ln
- 328 E 4th Ave
- 905 N Webster St
- 326 E 4th Ave
- 316 N Loomis St
- 1310 Eagle St
- 1314 N Eagle St
- 660 N Eagle St
- 1556 Shenandoah Ln
- 958 N Sleight St
- 948 N Sleight St
- 960 N Sleight St
- 946 N Sleight St
- 930 N Sleight St
- 957 N Sleight St
- 939 N Sleight St
- 1031 N Wright St
- 5S649 Wright St
- 928 N Sleight St
- 955 N Sleight St
- 971 N Sleight St
- 935 N Sleight St
- 508 E 11th Ave
- 1030 N Wright St
- 924 N Sleight St
- 5S635 Wright St
- 504 E 11th Ave
- 5 N Wright St
- 5S665 N Wright St