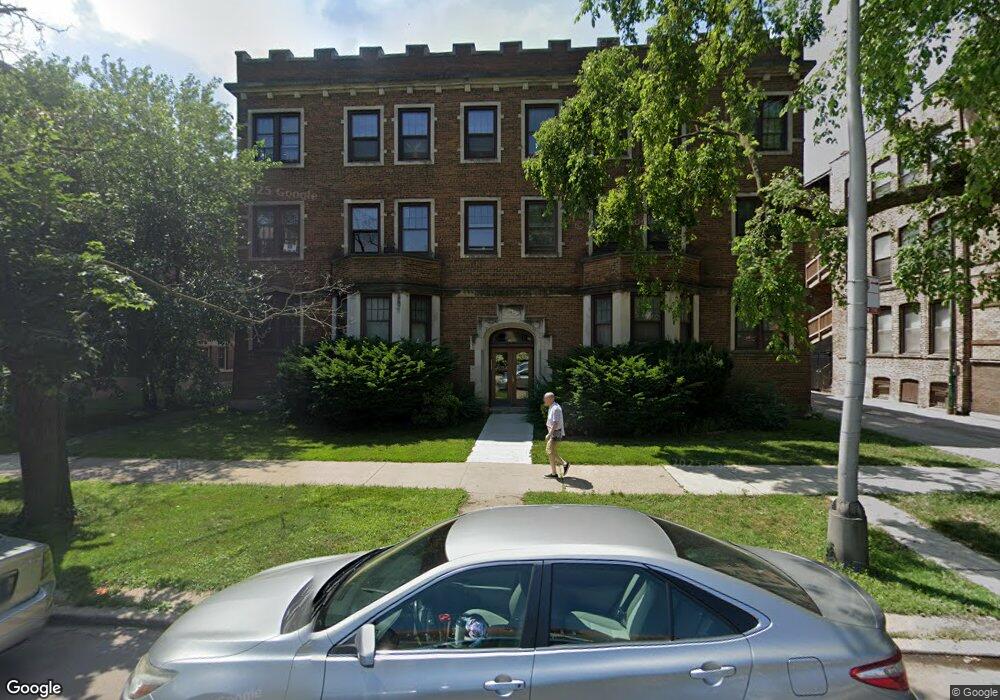
951 E Hyde Park Blvd Unit 3 Chicago, IL 60615
Hyde Park NeighborhoodEstimated Value: $793,000 - $1,178,000
4
Beds
3
Baths
3,100
Sq Ft
$325/Sq Ft
Est. Value
About This Home
This home is located at 951 E Hyde Park Blvd Unit 3, Chicago, IL 60615 and is currently estimated at $1,008,444, approximately $325 per square foot. 951 E Hyde Park Blvd Unit 3 is a home located in Cook County with nearby schools including Reavis Elementary Math & Science Specialty School, Kenwood Academy High School, and Bronzeville Academy Charter School.
Ownership History
Date
Name
Owned For
Owner Type
Purchase Details
Closed on
Aug 18, 2023
Sold by
Judicial Sales Corporation
Bought by
Renaissance Home Equity Loan Asset-Backed Cer and Cook
Current Estimated Value
Purchase Details
Closed on
Nov 23, 2003
Sold by
Crestar Inc
Bought by
Cook Rufus
Create a Home Valuation Report for This Property
The Home Valuation Report is an in-depth analysis detailing your home's value as well as a comparison with similar homes in the area
Home Values in the Area
Average Home Value in this Area
Purchase History
| Date | Buyer | Sale Price | Title Company |
|---|---|---|---|
| Renaissance Home Equity Loan Asset-Backed Cer | -- | None Listed On Document | |
| Cook Rufus | -- | -- |
Source: Public Records
Tax History Compared to Growth
Tax History
| Year | Tax Paid | Tax Assessment Tax Assessment Total Assessment is a certain percentage of the fair market value that is determined by local assessors to be the total taxable value of land and additions on the property. | Land | Improvement |
|---|---|---|---|---|
| 2024 | $9,324 | $88,000 | $16,393 | $71,607 |
| 2023 | $9,018 | $50,000 | $13,220 | $36,780 |
| 2022 | $9,018 | $50,000 | $13,220 | $36,780 |
| 2021 | $5,163 | $50,000 | $13,220 | $36,780 |
| 2020 | $15,261 | $68,505 | $10,576 | $57,929 |
| 2019 | $5,312 | $74,462 | $10,576 | $63,886 |
| 2018 | $5,232 | $74,462 | $10,576 | $63,886 |
| 2017 | $5,602 | $45,615 | $8,725 | $36,890 |
| 2016 | $9,136 | $45,615 | $8,725 | $36,890 |
| 2015 | $8,359 | $45,615 | $8,725 | $36,890 |
| 2014 | $6,628 | $35,723 | $7,138 | $28,585 |
| 2013 | $6,497 | $35,723 | $7,138 | $28,585 |
Source: Public Records
Map
Nearby Homes
- 947 E Hyde Park Blvd Unit G
- 945 E Hyde Park Blvd Unit 2
- 5107 S Ingleside Ave Unit 3
- 5118 S Ingleside Ave Unit A
- 5200 S Ellis Ave Unit 202
- 5200 S Ellis Ave Unit 508
- 5142 S Greenwood Ave Unit 1
- 1036 E Hyde Park Blvd
- 1059 E Hyde Park Blvd Unit 1
- 5133 S Greenwood Ave Unit 2
- 5132 S Drexel Ave Unit 2D
- 5223 S Drexel Ave Unit 2N
- 5052 S Drexel Blvd Unit 3C
- 5239 S Ingleside Ave
- 1000 E 53rd St Unit 119S
- 1000 E 53rd St Unit 511S
- 5230 S University Ave Unit D
- 1155 E Hyde Park Blvd Unit 2F
- 5110 S Woodlawn Ave Unit 3H
- 5108 S Woodlawn Ave Unit 2G
- 953 E Hyde Park Blvd Unit 1A
- 953 E Hyde Park Blvd Unit 2B
- 953 E Hyde Park Blvd Unit 2A
- 953 E Hyde Park Blvd Unit 1
- 951 E Hyde Park Blvd Unit 3B
- 951 E Hyde Park Blvd Unit 1B
- 5100 S Ellis Ave
- 5100 S Ellis Ave
- 5100 S Ellis Ave
- 949 E Hyde Park Blvd Unit 9493
- 949 E Hyde Park Blvd Unit 9491
- 949 E Hyde Park Blvd
- 949 E Hyde Park Blvd Unit 9492
- 949 E Hyde Park Blvd Unit 1
- 949 E Hyde Park Blvd Unit 2
- 5120 S Ellis Ave
- 5105 S Ingleside Ave Unit 3
- 931 E Hyde Park Blvd Unit 9311
- 5105 S Ingleside Ave Unit 5105
- 5105 S Ingleside Ave Unit 5105