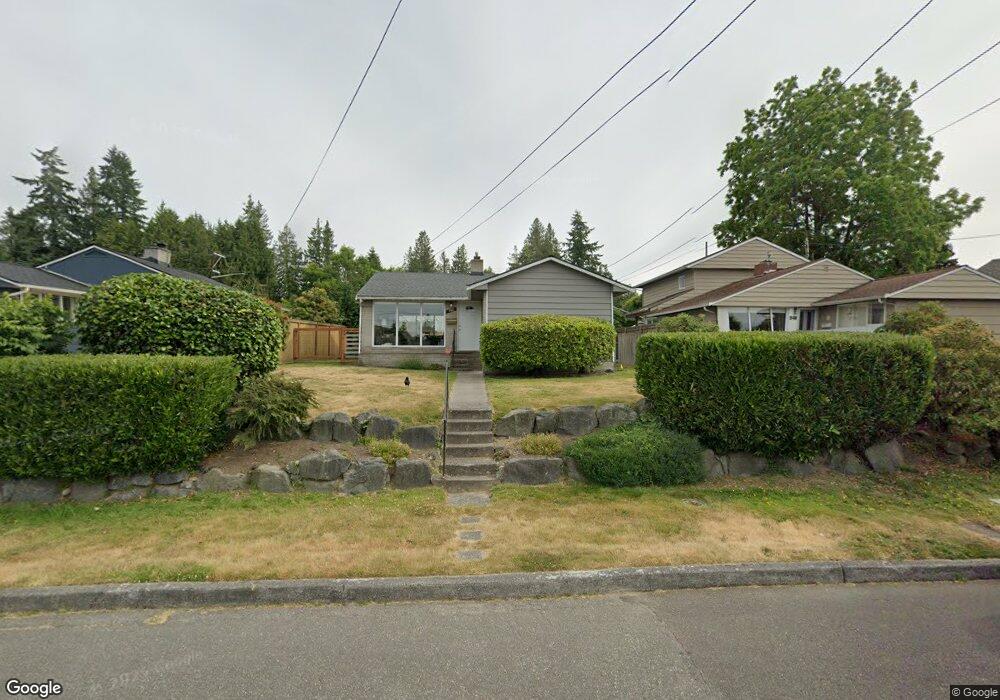
952 Alder St Edmonds, WA 98020
Westgate NeighborhoodEstimated Value: $816,000 - $863,000
2
Beds
1
Bath
888
Sq Ft
$936/Sq Ft
Est. Value
About This Home
This home is located at 952 Alder St, Edmonds, WA 98020 and is currently estimated at $831,425, approximately $936 per square foot. 952 Alder St is a home located in Snohomish County with nearby schools including Westgate Elementary School, College Place Middle School, and Edmonds-Woodway High School.
Ownership History
Date
Name
Owned For
Owner Type
Purchase Details
Closed on
Aug 7, 2024
Sold by
Sheron Properties Llc
Bought by
Sheron Shirley K
Current Estimated Value
Purchase Details
Closed on
Jul 12, 2024
Sold by
Sheron Shirley K
Bought by
Hagen Revocable Living Trust and Hagen
Purchase Details
Closed on
Sep 26, 2017
Sold by
Edward J & Shirley K Sheron Trust and Sheron Edward J
Bought by
Sheron Properties Llc
Purchase Details
Closed on
Jul 11, 2011
Sold by
Goransson Rosemary
Bought by
Sheron Edward J and Sheron Shirley K
Purchase Details
Closed on
Jun 24, 2010
Sold by
Sheron Shirley K
Bought by
Sheron Edward J and Sheron Shirley K
Purchase Details
Closed on
Mar 29, 2006
Sold by
Sheron Shirley K
Bought by
Sheron Edward J and Sheron Shirley K
Purchase Details
Closed on
Dec 20, 1993
Sold by
Kraushar Ilene T
Bought by
Goransson Rosemary and Sheron Shirley
Create a Home Valuation Report for This Property
The Home Valuation Report is an in-depth analysis detailing your home's value as well as a comparison with similar homes in the area
Home Values in the Area
Average Home Value in this Area
Purchase History
| Date | Buyer | Sale Price | Title Company |
|---|---|---|---|
| Sheron Shirley K | $313 | None Listed On Document | |
| Hagen Revocable Living Trust | $313 | None Listed On Document | |
| Sheron Properties Llc | -- | None Available | |
| Sheron Edward J | $113,000 | Pnwt | |
| Sheron Edward J | -- | None Available | |
| Goransson Rosemary | -- | None Available | |
| Sheron Edward J | -- | None Available | |
| Goransson Rosemary | -- | -- |
Source: Public Records
Tax History Compared to Growth
Tax History
| Year | Tax Paid | Tax Assessment Tax Assessment Total Assessment is a certain percentage of the fair market value that is determined by local assessors to be the total taxable value of land and additions on the property. | Land | Improvement |
|---|---|---|---|---|
| 2025 | $5,130 | $705,300 | $598,800 | $106,500 |
| 2024 | $5,130 | $721,000 | $614,500 | $106,500 |
| 2023 | $5,239 | $763,100 | $632,100 | $131,000 |
| 2022 | $5,580 | $668,100 | $557,100 | $111,000 |
| 2020 | $5,174 | $554,100 | $455,700 | $98,400 |
| 2019 | $4,708 | $507,800 | $411,100 | $96,700 |
| 2018 | $4,787 | $446,100 | $359,900 | $86,200 |
| 2017 | $4,151 | $404,800 | $325,500 | $79,300 |
| 2016 | $3,811 | $368,200 | $292,000 | $76,200 |
| 2015 | $3,563 | $324,100 | $285,000 | $39,100 |
| 2013 | $2,648 | $227,200 | $189,000 | $38,200 |
Source: Public Records
Map
Nearby Homes
- 1021 Walnut St
- 9533 Bowdoin Way
- 816 Walnut St
- 21232 92nd Place W
- 21703 97th Ave W
- 302 6th Ave S
- 8804 209th Place SW
- 621 Daley St
- 609 7th Ave N Unit B204
- 603 7th Ave N Unit A306
- 8732 209th Place SW
- 1221 Coronado Place
- 22039 98th Place W
- 960 5th Ave S Unit 208
- 335 3rd Ave S Unit 203
- 233 3rd Ave S Unit 304
- 637 Elm Place
- 625 Aloha Way
- 22212 98th Ave W
- 8500 Main St Unit F313