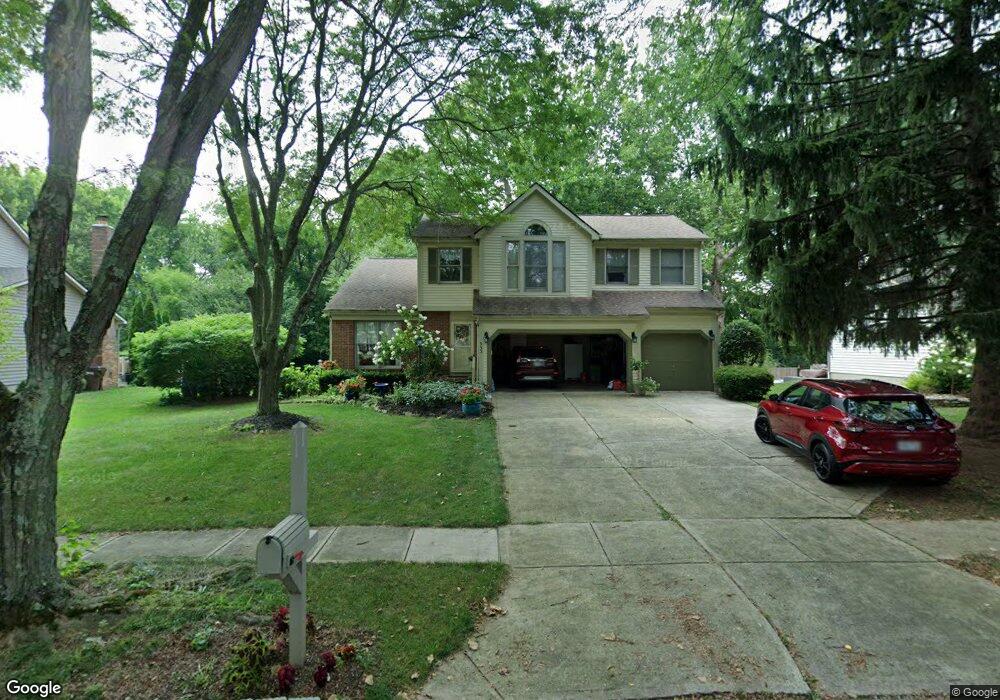
953 Dunmore Ct Pickerington, OH 43147
Estimated Value: $424,540 - $447,000
3
Beds
4
Baths
2,333
Sq Ft
$187/Sq Ft
Est. Value
About This Home
This home is located at 953 Dunmore Ct, Pickerington, OH 43147 and is currently estimated at $436,885, approximately $187 per square foot. 953 Dunmore Ct is a home located in Fairfield County with nearby schools including Violet Elementary School, Pickerington Lakeview Junior High School, and Toll Gate Middle School.
Ownership History
Date
Name
Owned For
Owner Type
Purchase Details
Closed on
Aug 29, 2008
Sold by
Powers James L and Powers Christy L
Bought by
Noel Janice A
Current Estimated Value
Home Financials for this Owner
Home Financials are based on the most recent Mortgage that was taken out on this home.
Original Mortgage
$176,400
Interest Rate
6.66%
Mortgage Type
Purchase Money Mortgage
Purchase Details
Closed on
Jan 9, 2008
Sold by
Deck Lisha R and Bank One Na
Bought by
Powers James L and Powers Christy L
Home Financials for this Owner
Home Financials are based on the most recent Mortgage that was taken out on this home.
Original Mortgage
$129,150
Interest Rate
6.32%
Mortgage Type
Purchase Money Mortgage
Purchase Details
Closed on
Nov 29, 1991
Bought by
M/I Schottenstein Homes Inc
Purchase Details
Closed on
Jun 13, 1991
Bought by
M/I Schottenstein Homes Inc
Create a Home Valuation Report for This Property
The Home Valuation Report is an in-depth analysis detailing your home's value as well as a comparison with similar homes in the area
Home Values in the Area
Average Home Value in this Area
Purchase History
| Date | Buyer | Sale Price | Title Company |
|---|---|---|---|
| Noel Janice A | $207,600 | Talon Title | |
| Powers James L | $143,500 | None Available | |
| M/I Schottenstein Homes Inc | $147,500 | -- | |
| M/I Schottenstein Homes Inc | $23,000 | -- |
Source: Public Records
Mortgage History
| Date | Status | Borrower | Loan Amount |
|---|---|---|---|
| Closed | Noel Janice A | $176,400 | |
| Previous Owner | Powers James L | $129,150 |
Source: Public Records
Tax History
| Year | Tax Paid | Tax Assessment Tax Assessment Total Assessment is a certain percentage of the fair market value that is determined by local assessors to be the total taxable value of land and additions on the property. | Land | Improvement |
|---|---|---|---|---|
| 2025 | $15,951 | $158,310 | $31,550 | $126,760 |
| 2024 | $15,951 | $129,580 | $18,260 | $111,320 |
| 2023 | $5,677 | $129,580 | $18,260 | $111,320 |
| 2022 | $5,715 | $129,580 | $18,260 | $111,320 |
| 2021 | $5,106 | $100,690 | $16,600 | $84,090 |
| 2020 | $5,162 | $100,690 | $16,600 | $84,090 |
| 2019 | $5,195 | $100,690 | $16,600 | $84,090 |
| 2018 | $4,784 | $82,420 | $16,600 | $65,820 |
| 2017 | $4,791 | $82,560 | $16,740 | $65,820 |
| 2016 | $4,767 | $82,560 | $16,740 | $65,820 |
| 2015 | $4,477 | $74,300 | $13,950 | $60,350 |
| 2014 | $4,423 | $74,300 | $13,950 | $60,350 |
| 2013 | $4,423 | $74,300 | $13,950 | $60,350 |
Source: Public Records
Map
Nearby Homes
- 873 Falkirk Ct
- 12248 Tanglewood Ln
- 692 Hill Rd N
- 9656 Meadow Wood Dr
- 9841 Woodsfield Cir S
- 1333 Brookview Cir
- 807 Littleton Dr
- 12200 Raintree Ave
- 1259 Somerset Way Unit 1259
- 492 Courtright Dr
- 780 Diley Rd
- 559 Cherry Hill Dr
- 12517 Heritage Way NW
- 8641 Easton Dr
- 760 N Starr Dr
- 0 Windmiller Dr
- 477 Courtland Ln
- 12204 Taylors Way
- 8591 Springflower Dr
- 636 Kelburn Ln
- 955 Dunmore Ct
- 951 Dunmore Ct
- 996 Inverness Glen
- 992 Inverness Glen
- 949 Dunmore Ct
- 957 Dunmore Ct
- 968 Dunmore Ct
- 988 Inverness Glen
- 966 Dunmore Ct
- 998 Inverness Glen
- 970 Dunmore Ct
- 959 Dunmore Ct
- 947 Dunmore Ct
- 932 Carron Ct
- 984 Inverness Glen
- 962 Dunmore Ct
- 997 Inverness Glenn
- 997 Inverness Glen
- 1012 McLeod Parc
- 938 Carron Cir
Your Personal Tour Guide
Ask me questions while you tour the home.