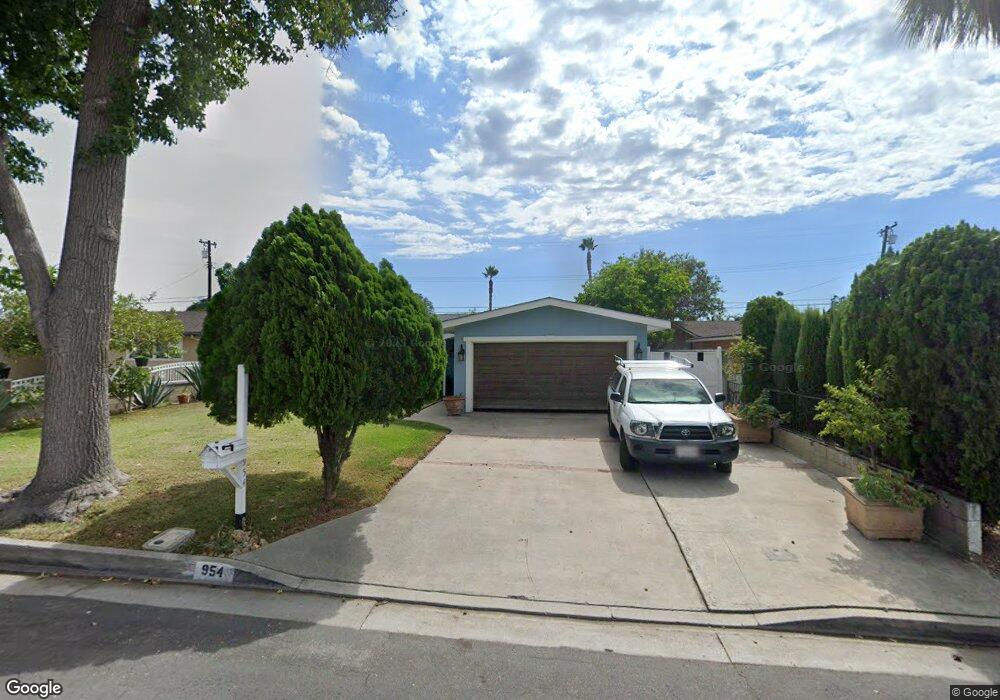
954 E Galatea St Azusa, CA 91702
South Glendora NeighborhoodEstimated Value: $730,509 - $816,000
4
Beds
2
Baths
1,444
Sq Ft
$531/Sq Ft
Est. Value
About This Home
This home is located at 954 E Galatea St, Azusa, CA 91702 and is currently estimated at $766,627, approximately $530 per square foot. 954 E Galatea St is a home located in Los Angeles County with nearby schools including Magnolia Elementary School, Azusa High School, and Christbridge Academy.
Ownership History
Date
Name
Owned For
Owner Type
Purchase Details
Closed on
Nov 5, 2003
Sold by
Delrefugio Maria
Bought by
Martinez Roberto
Current Estimated Value
Home Financials for this Owner
Home Financials are based on the most recent Mortgage that was taken out on this home.
Original Mortgage
$220,001
Interest Rate
5.89%
Mortgage Type
FHA
Purchase Details
Closed on
Sep 24, 2003
Sold by
Cornejo Amparo and Cornejo Albina R
Bought by
Martinez Roberto
Home Financials for this Owner
Home Financials are based on the most recent Mortgage that was taken out on this home.
Original Mortgage
$220,001
Interest Rate
5.89%
Mortgage Type
FHA
Purchase Details
Closed on
Mar 21, 1994
Sold by
Aquirre Victoria
Bought by
Cornejo Amparo
Home Financials for this Owner
Home Financials are based on the most recent Mortgage that was taken out on this home.
Original Mortgage
$88,600
Interest Rate
7.59%
Create a Home Valuation Report for This Property
The Home Valuation Report is an in-depth analysis detailing your home's value as well as a comparison with similar homes in the area
Home Values in the Area
Average Home Value in this Area
Purchase History
| Date | Buyer | Sale Price | Title Company |
|---|---|---|---|
| Martinez Roberto | -- | Southland Title Corporation | |
| Martinez Roberto | $275,000 | Southland Title Corporation | |
| Cornejo Amparo | -- | Gateway Title Company |
Source: Public Records
Mortgage History
| Date | Status | Borrower | Loan Amount |
|---|---|---|---|
| Previous Owner | Martinez Roberto | $220,001 | |
| Previous Owner | Cornejo Amparo | $88,600 |
Source: Public Records
Tax History
| Year | Tax Paid | Tax Assessment Tax Assessment Total Assessment is a certain percentage of the fair market value that is determined by local assessors to be the total taxable value of land and additions on the property. | Land | Improvement |
|---|---|---|---|---|
| 2025 | $4,983 | $390,972 | $259,752 | $131,220 |
| 2024 | $4,983 | $383,307 | $254,659 | $128,648 |
| 2023 | $4,851 | $375,792 | $249,666 | $126,126 |
| 2022 | $4,790 | $368,424 | $244,771 | $123,653 |
| 2021 | $4,668 | $361,201 | $239,972 | $121,229 |
| 2019 | $4,514 | $350,489 | $232,855 | $117,634 |
| 2018 | $4,316 | $343,618 | $228,290 | $115,328 |
| 2016 | $4,132 | $330,276 | $219,426 | $110,850 |
| 2015 | $4,064 | $325,316 | $216,131 | $109,185 |
| 2014 | $3,798 | $318,945 | $211,898 | $107,047 |
Source: Public Records
Map
Nearby Homes
- 5902 N Viceroy Ave
- 18453 E Armstead St
- 1021 E Gaillard St
- 18347 E Bellefont Dr
- 18640 E Mauna Loa Ave
- 5825 N Orangecrest Ave
- 6003 N Briargate Ln
- 5441 N Ranger Dr
- 5844 Glenfinnan Ave
- 5505 N Traymore Ave
- 716 E Hanks St
- 19003 E Haltern Ave
- 337 N Fenimore Ave
- 5657 Glenfinnan Ave
- 1630 41 S Barranca Avenue Spc 41
- 1356 S Prospero Dr
- 777 S Citrus Ave Unit 232
- 1039 Brightview Dr
- 1235 Delay Ave
- 18725 E Arrow Hwy Unit 43
- 948 E Galatea St
- 958 E Galatea St
- 953 E Citrus Edge St
- 947 E Citrus Edge St
- 957 E Citrus Edge St
- 944 E Galatea St
- 964 E Galatea St
- 951 E Galatea St
- 943 E Citrus Edge St
- 963 E Citrus Edge St
- 945 E Galatea St
- 955 E Galatea St
- 938 E Galatea St
- 968 E Galatea St
- 941 E Galatea St
- 961 E Galatea St
- 937 E Citrus Edge St
- 967 E Citrus Edge St
- 935 E Galatea St
- 965 E Galatea St
Your Personal Tour Guide
Ask me questions while you tour the home.