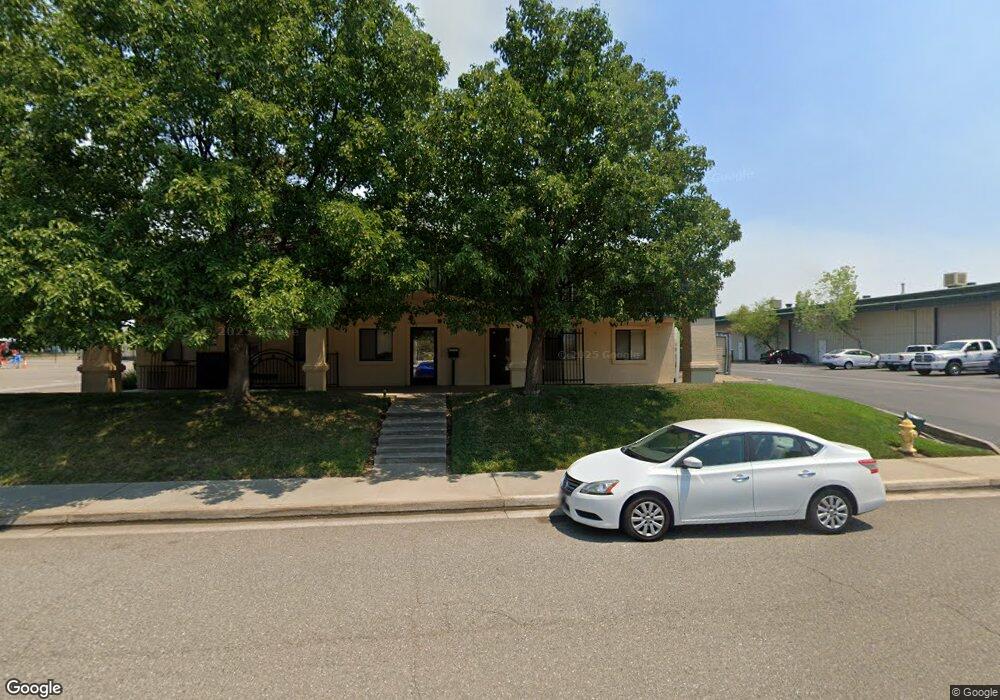
9559 Crossroads Dr Redding, CA 96003
Estimated Value: $539,711
Studio
2
Baths
4,225
Sq Ft
$128/Sq Ft
Est. Value
About This Home
This home is located at 9559 Crossroads Dr, Redding, CA 96003 and is currently estimated at $539,711, approximately $127 per square foot. 9559 Crossroads Dr is a home located in Shasta County with nearby schools including Columbia Elementary School, Mountain View Middle School, and Foothill High School.
Ownership History
Date
Name
Owned For
Owner Type
Purchase Details
Closed on
Aug 26, 2010
Sold by
Sloan Daniel W and Sloan Carol L
Bought by
Bambino Ted A and Bambino Erin
Current Estimated Value
Home Financials for this Owner
Home Financials are based on the most recent Mortgage that was taken out on this home.
Original Mortgage
$107,204
Outstanding Balance
$71,077
Interest Rate
4.52%
Mortgage Type
Commercial
Estimated Equity
$468,634
Purchase Details
Closed on
Jan 20, 2006
Sold by
Wyatt James A
Bought by
Wyatt James A and Wyatt Cathleen E
Purchase Details
Closed on
Jun 12, 2001
Sold by
Tanqueray Corp
Bought by
Sloan Daniel W and Sloan Carol L
Home Financials for this Owner
Home Financials are based on the most recent Mortgage that was taken out on this home.
Original Mortgage
$200,000
Interest Rate
7.14%
Mortgage Type
Commercial
Create a Home Valuation Report for This Property
The Home Valuation Report is an in-depth analysis detailing your home's value as well as a comparison with similar homes in the area
Purchase History
| Date | Buyer | Sale Price | Title Company |
|---|---|---|---|
| Bambino Ted A | $260,000 | Placer Title Company | |
| Sloan Daniel W | -- | Placer Title Company | |
| Wyatt James A | -- | First American Title Co | |
| Sloan Daniel W | $245,000 | Placer Title Company |
Source: Public Records
Mortgage History
| Date | Status | Borrower | Loan Amount |
|---|---|---|---|
| Open | Sloan Daniel W | $107,204 | |
| Closed | Bambino Ted A | $134,005 | |
| Previous Owner | Sloan Daniel W | $200,000 |
Source: Public Records
Tax History Compared to Growth
Tax History
| Year | Tax Paid | Tax Assessment Tax Assessment Total Assessment is a certain percentage of the fair market value that is determined by local assessors to be the total taxable value of land and additions on the property. | Land | Improvement |
|---|---|---|---|---|
| 2025 | $3,721 | $336,838 | $64,052 | $272,786 |
| 2024 | $3,734 | $330,235 | $62,797 | $267,438 |
| 2023 | $3,734 | $320,161 | $61,566 | $258,595 |
| 2022 | $3,564 | $313,884 | $60,359 | $253,525 |
| 2021 | $3,547 | $307,730 | $59,176 | $248,554 |
| 2020 | $3,522 | $304,576 | $58,570 | $246,006 |
| 2019 | $3,442 | $298,605 | $57,422 | $241,183 |
| 2018 | $3,461 | $292,751 | $56,297 | $236,454 |
| 2017 | $3,501 | $287,012 | $55,194 | $231,818 |
| 2016 | $3,282 | $281,385 | $54,112 | $227,273 |
| 2015 | $3,231 | $277,160 | $53,300 | $223,860 |
| 2014 | $3,145 | $271,731 | $52,256 | $219,475 |
Source: Public Records
Map
Nearby Homes
- 0 Lot8 Unit 2 Ph 2 Stillwater Ra Unit 25-4966
- 0 Lot14 Unit 2 Ph 2 Stillwater Unit 25-4956
- 0 Lot12 Unit 2 Ph 2 Stillwater Unit 25-4954
- 0 Lot15 Unit 2 Ph 2 Stillwater Unit 25-4957
- 0 Lot1 Phase2 Stillwater Ranch Unit 25-4951
- 0 Lot2 Phase2 Stillwater Ranch Unit 25-4959
- 3035 Argyle Rd
- 0 Lot13 Unit 2 Ph 2 Stillwater Unit 25-4955
- Lot4 Phase2 Stillwater Ranch
- 3385 Wimbledon Dr
- 9105 Madrone Way
- 10025 Harley Leighton Rd
- 20822 Clough Creek Rd
- 2912 Squire Ave
- 3863 Indian Wells Ln
- 3685 Wimbledon Dr
- 3183 Agassi Ln
- 3156 Niklaus Path
- 2850 Oakview Dr
- 3792 Thomason Trail
- 9555 Crossroads Dr
- 9565 Tanqueray Ct
- 9565 Crossroads Dr
- 9560 Crossroads Dr
- 9677 Tanqueray Ct
- 0 Tanqueray Ct
- 9588 Crossroads Dr
- 9530 Crossroads Dr
- 9650 Tanqueray Ct
- 9690 Tanqueray Ct
- 9702 Tanqueray Ct
- 9714 Tanqueray Ct
- 9638 Tanqueray Ct
- 9512 Crossroads Dr
- 9539 Old Oregon Trail
- 2950 Old Oregon Trail
- 3790 Old 44 Dr
- 3985 Old 44 Dr
- 9574 Peaceful Ln
- 9605 Old Oregon Trail