
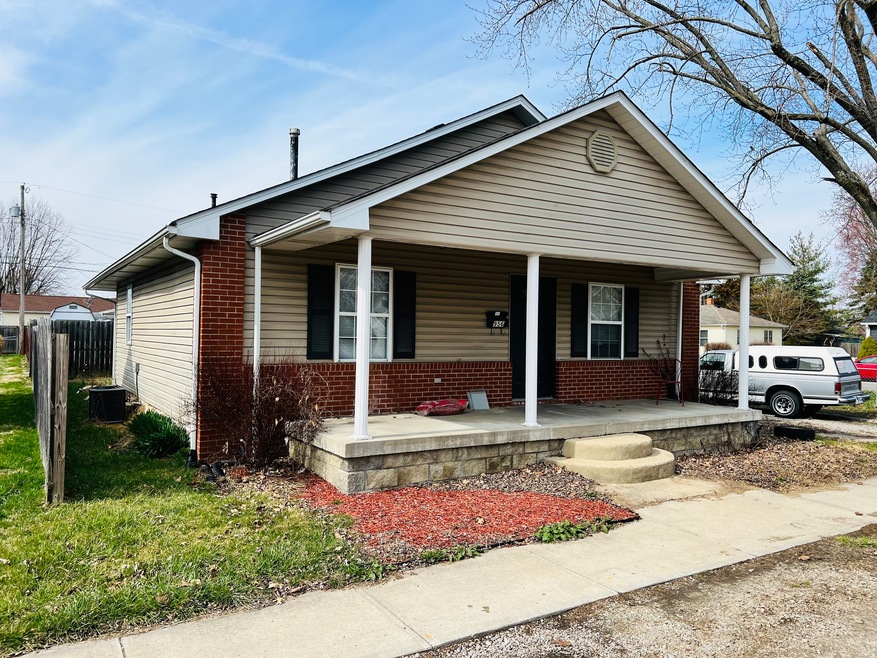
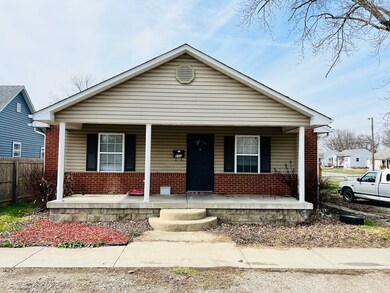
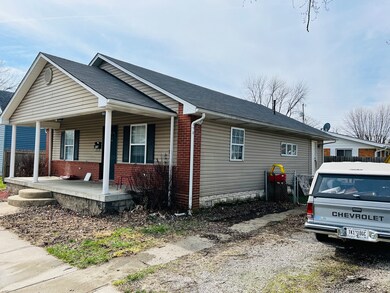
956 Graham St Franklin, IN 46131
3
Beds
2
Baths
1,240
Sq Ft
5,981
Sq Ft Lot
Highlights
- Traditional Architecture
- Eat-In Kitchen
- 1-Story Property
- No HOA
- Walk-In Closet
- Forced Air Heating System
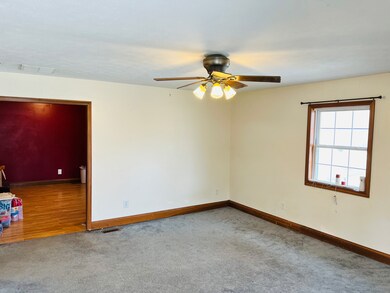
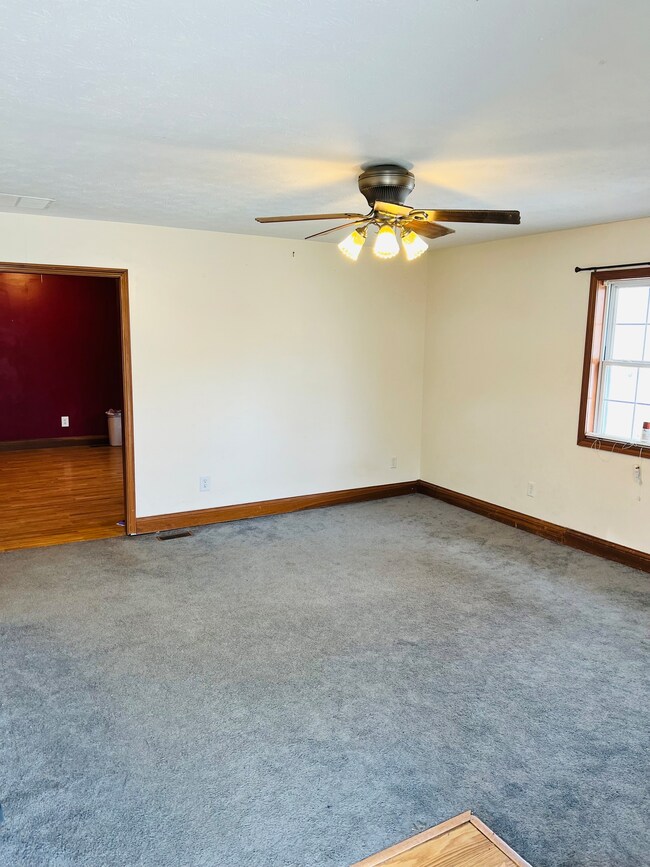
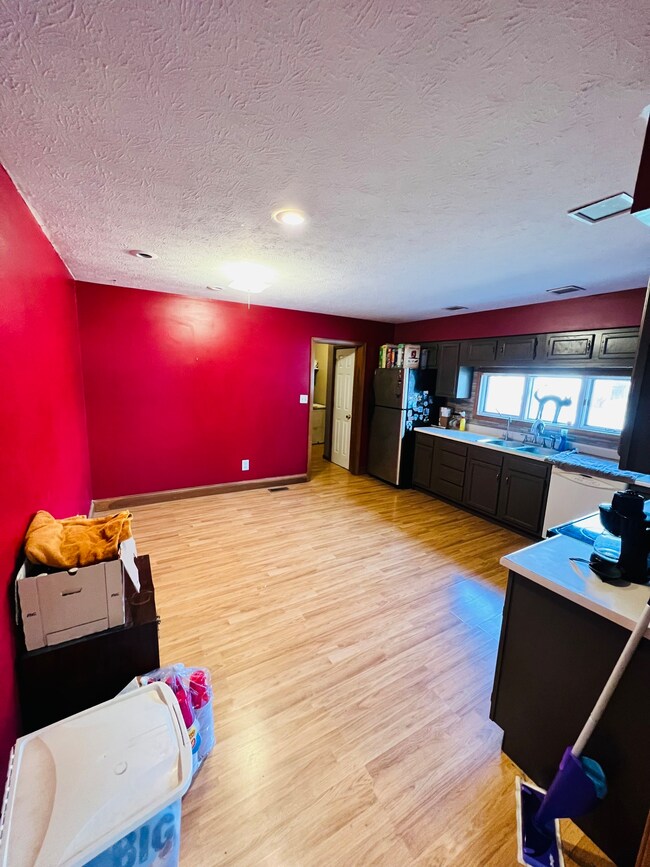
About This Home
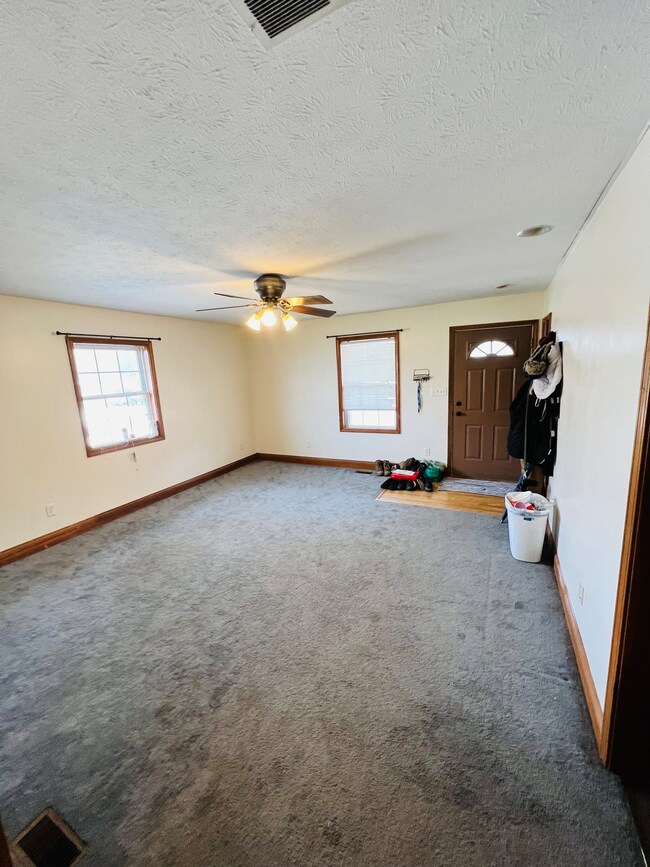
As of May 2023Welcome home to this charming 3BD/2BA home in Franklin. Eat-in kitchen with pantry and plenty of cabinets. Ceiling fans in Living room and bedrooms. Master Bedroom has WIC. Large front porch, fenced in yard. Storage shed included.
Last Buyer's Agent
Jessica Jackson
F.C. Tucker Company
Home Details
Home Type
- Single Family
Est. Annual Taxes
- $1,112
Year Built
- Built in 1910
Lot Details
- 5,981 Sq Ft Lot
Home Design
- Traditional Architecture
- Block Foundation
- Vinyl Siding
Interior Spaces
- 1,240 Sq Ft Home
- 1-Story Property
- Paddle Fans
- Window Screens
- Combination Kitchen and Dining Room
- Attic Access Panel
- Fire and Smoke Detector
Kitchen
- Eat-In Kitchen
- Electric Oven
- Dishwasher
Flooring
- Carpet
- Laminate
Bedrooms and Bathrooms
- 3 Bedrooms
- Walk-In Closet
- 2 Full Bathrooms
Schools
- Franklin Community Middle School
- Franklin Community High School
Utilities
- Forced Air Heating System
- Heating System Uses Gas
- Gas Water Heater
Community Details
- No Home Owners Association
Listing and Financial Details
- Assessor Parcel Number 410814021160000009
Ownership History
Date
Name
Owned For
Owner Type
Purchase Details
Listed on
Mar 6, 2023
Closed on
May 1, 2023
Sold by
Curtis Jacob T
Bought by
Haskins Kylie and Haskins Jeffrey
Seller's Agent
Neil Tremblett
F.C. Tucker Company
Buyer's Agent
Jessica Jackson
F.C. Tucker Company
List Price
$200,000
Sold Price
$190,000
Premium/Discount to List
-$10,000
-5%
Total Days on Market
24
Views
313
Current Estimated Value
Home Financials for this Owner
Home Financials are based on the most recent Mortgage that was taken out on this home.
Estimated Appreciation
$12,145
Avg. Annual Appreciation
3.05%
Original Mortgage
$186,558
Outstanding Balance
$182,245
Interest Rate
6.25%
Mortgage Type
FHA
Estimated Equity
$19,900
Purchase Details
Listed on
Jul 26, 2018
Closed on
Sep 7, 2018
Sold by
Messer Courtney J
Bought by
Curtis Jacob T and Tompkins Carissa N
Seller's Agent
Sarah Milner
Carpenter, REALTORS®
Buyer's Agent
Barbara Wineinger
Weichert, Realtors-Tralee Prop
List Price
$124,900
Sold Price
$111,000
Premium/Discount to List
-$13,900
-11.13%
Home Financials for this Owner
Home Financials are based on the most recent Mortgage that was taken out on this home.
Avg. Annual Appreciation
12.25%
Original Mortgage
$108,989
Interest Rate
4.87%
Mortgage Type
FHA
Purchase Details
Listed on
Jul 21, 2016
Closed on
Sep 21, 2016
Sold by
Allyson Enterprises Llc
Bought by
Messer Courtney J
Seller's Agent
Christy Norton
Norton Premier Real Estate
Buyer's Agent
Sarah Milner
Carpenter, REALTORS®
List Price
$99,900
Sold Price
$92,500
Premium/Discount to List
-$7,400
-7.41%
Home Financials for this Owner
Home Financials are based on the most recent Mortgage that was taken out on this home.
Avg. Annual Appreciation
9.75%
Purchase Details
Closed on
Nov 19, 2015
Sold by
Cox Douglas F and Feyeraband Ryan E
Bought by
Deutsche Bank National Trust Company
Map
Create a Home Valuation Report for This Property
The Home Valuation Report is an in-depth analysis detailing your home's value as well as a comparison with similar homes in the area
Similar Homes in Franklin, IN
Home Values in the Area
Average Home Value in this Area
Purchase History
| Date | Type | Sale Price | Title Company |
|---|---|---|---|
| Warranty Deed | $190,000 | None Listed On Document | |
| Warranty Deed | -- | Security Title | |
| Warranty Deed | -- | None Available | |
| Sheriffs Deed | $61,000 | Attorney |
Source: Public Records
Mortgage History
| Date | Status | Loan Amount | Loan Type |
|---|---|---|---|
| Open | $186,558 | FHA | |
| Previous Owner | $108,989 | FHA | |
| Closed | $0 | No Value Available |
Source: Public Records
Property History
| Date | Event | Price | Change | Sq Ft Price |
|---|---|---|---|---|
| 05/01/2023 05/01/23 | Sold | $190,000 | 0.0% | $153 / Sq Ft |
| 03/31/2023 03/31/23 | Pending | -- | -- | -- |
| 03/28/2023 03/28/23 | Price Changed | $190,000 | -2.6% | $153 / Sq Ft |
| 03/17/2023 03/17/23 | Price Changed | $195,000 | -2.5% | $157 / Sq Ft |
| 03/06/2023 03/06/23 | For Sale | $200,000 | +80.2% | $161 / Sq Ft |
| 09/07/2018 09/07/18 | Sold | $111,000 | -3.5% | $90 / Sq Ft |
| 08/10/2018 08/10/18 | Pending | -- | -- | -- |
| 08/03/2018 08/03/18 | Price Changed | $115,000 | -4.1% | $93 / Sq Ft |
| 07/30/2018 07/30/18 | Price Changed | $119,900 | -4.0% | $97 / Sq Ft |
| 07/26/2018 07/26/18 | For Sale | $124,900 | +35.0% | $101 / Sq Ft |
| 09/21/2016 09/21/16 | Sold | $92,500 | 0.0% | $75 / Sq Ft |
| 08/02/2016 08/02/16 | Off Market | $92,500 | -- | -- |
| 07/28/2016 07/28/16 | Price Changed | $94,900 | -5.0% | $77 / Sq Ft |
| 07/21/2016 07/21/16 | For Sale | $99,900 | +178.8% | $81 / Sq Ft |
| 04/21/2016 04/21/16 | Sold | $35,829 | -19.1% | $29 / Sq Ft |
| 03/28/2016 03/28/16 | Pending | -- | -- | -- |
| 03/09/2016 03/09/16 | Price Changed | $44,300 | -11.0% | $36 / Sq Ft |
| 01/29/2016 01/29/16 | Price Changed | $49,800 | -7.6% | $40 / Sq Ft |
| 01/14/2016 01/14/16 | Price Changed | $53,900 | -7.9% | $43 / Sq Ft |
| 01/06/2016 01/06/16 | Price Changed | $58,500 | -4.9% | $47 / Sq Ft |
| 12/04/2015 12/04/15 | For Sale | $61,500 | -- | $50 / Sq Ft |
Source: MIBOR Broker Listing Cooperative®
Tax History
| Year | Tax Paid | Tax Assessment Tax Assessment Total Assessment is a certain percentage of the fair market value that is determined by local assessors to be the total taxable value of land and additions on the property. | Land | Improvement |
|---|---|---|---|---|
| 2024 | $1,678 | $153,800 | $15,400 | $138,400 |
| 2023 | $1,322 | $123,700 | $15,400 | $108,300 |
| 2022 | $1,211 | $112,200 | $14,000 | $98,200 |
| 2021 | $1,111 | $103,500 | $13,500 | $90,000 |
| 2020 | $1,197 | $111,000 | $13,500 | $97,500 |
| 2019 | $1,098 | $102,400 | $11,600 | $90,800 |
| 2018 | $840 | $89,000 | $11,600 | $77,400 |
| 2017 | $817 | $88,100 | $11,600 | $76,500 |
| 2016 | $1,949 | $87,300 | $11,600 | $75,700 |
| 2014 | $1,770 | $96,000 | $18,100 | $77,900 |
| 2013 | $1,770 | $88,500 | $18,100 | $70,400 |
Source: Public Records
Source: MIBOR Broker Listing Cooperative®
MLS Number: 21908241
APN: 41-08-14-021-160.000-009
Disclaimer: Certain information contained herein is derived from information provided by parties other than Homes.com. All information provided is deemed reliable, but is not guaranteed to be accurate and should be independently verified.
![]() Based on information submitted to the MLS GRID. All data is obtained from various sources and may not have been verified by broker or MLS GRID. Supplied Open House Information is subject to change without notice. All information should be independently reviewed and verified for accuracy. Properties may or may not be listed by the office/agent presenting the information. Some IDX listings have been excluded from this website.
Based on information submitted to the MLS GRID. All data is obtained from various sources and may not have been verified by broker or MLS GRID. Supplied Open House Information is subject to change without notice. All information should be independently reviewed and verified for accuracy. Properties may or may not be listed by the office/agent presenting the information. Some IDX listings have been excluded from this website.
Nearby Homes
- 1100 Graham St
- 1150 Younce St
- 741 Walnut St
- 997 Yandes St
- 601 Duane St
- 498 Johnson Ave
- 422 Johnson Ave
- 1508 Douglas Dr
- 301 N Main St
- 350 Johnson Ave
- 598 Young St
- 323 E Adams St
- 650 Overstreet St
- 0 W 900 Hwy Unit 202421274
- 196 E Madison St
- 550 W King St
- 300 E Monroe St
- 150 S Main St Unit 404
- 150 S Main St Unit 204
- 150 S Main St Unit 403