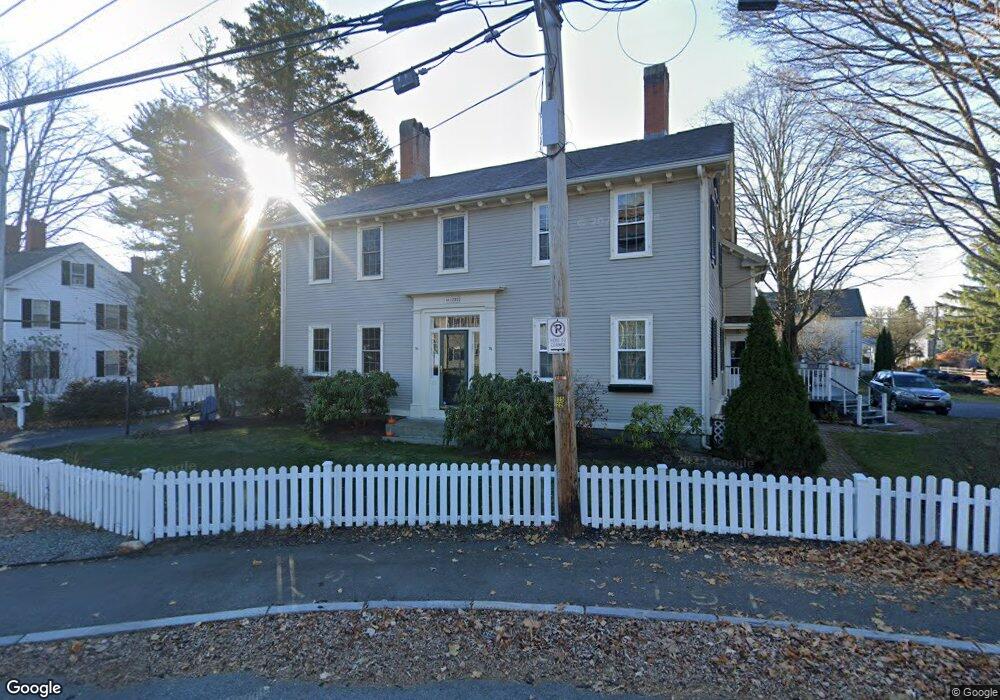
96 Main St Exeter, NH 03833
Estimated Value: $474,000 - $597,000
2
Beds
2
Baths
1,562
Sq Ft
$353/Sq Ft
Est. Value
About This Home
This home is located at 96 Main St, Exeter, NH 03833 and is currently estimated at $551,064, approximately $352 per square foot. 96 Main St is a home located in Rockingham County with nearby schools including Main Street School, Lincoln Street Elementary School, and Cooperative Middle School.
Ownership History
Date
Name
Owned For
Owner Type
Purchase Details
Closed on
Sep 11, 2024
Sold by
Daschbach Virginia H
Bought by
Virginia H Daschbach T H and Virginia Daschbach
Current Estimated Value
Purchase Details
Closed on
Sep 9, 2022
Sold by
Huebner Family 2012 Ret and Huebner
Bought by
Spanjian Richard and Spanjian Marilee
Purchase Details
Closed on
Jun 14, 2018
Sold by
Hayner Mark H and Hayner Maryann E
Bought by
Macdonald Philip D and Macdonald Barbara G
Purchase Details
Closed on
Aug 7, 2001
Sold by
Taylor Virginia C
Bought by
Hayner Mark H and Hayner Maryann E
Home Financials for this Owner
Home Financials are based on the most recent Mortgage that was taken out on this home.
Original Mortgage
$243,200
Interest Rate
7.14%
Create a Home Valuation Report for This Property
The Home Valuation Report is an in-depth analysis detailing your home's value as well as a comparison with similar homes in the area
Home Values in the Area
Average Home Value in this Area
Purchase History
| Date | Buyer | Sale Price | Title Company |
|---|---|---|---|
| Virginia H Daschbach T H | -- | None Available | |
| Virginia H Daschbach T H | -- | None Available | |
| Spanjian Richard | $450,000 | None Available | |
| Spanjian Richard | $450,000 | None Available | |
| Macdonald Philip D | $285,000 | -- | |
| Macdonald Philip D | $285,000 | -- | |
| Hayner Mark H | $304,000 | -- | |
| Hayner Mark H | $304,000 | -- |
Source: Public Records
Mortgage History
| Date | Status | Borrower | Loan Amount |
|---|---|---|---|
| Previous Owner | Hayner Mark H | $243,200 |
Source: Public Records
Tax History
| Year | Tax Paid | Tax Assessment Tax Assessment Total Assessment is a certain percentage of the fair market value that is determined by local assessors to be the total taxable value of land and additions on the property. | Land | Improvement |
|---|---|---|---|---|
| 2025 | $8,977 | $478,500 | $0 | $478,500 |
| 2024 | $8,513 | $478,500 | $0 | $478,500 |
| 2023 | $7,458 | $278,500 | $0 | $278,500 |
| 2022 | $6,893 | $278,500 | $0 | $278,500 |
| 2021 | $6,687 | $278,500 | $0 | $278,500 |
| 2020 | $6,820 | $278,500 | $0 | $278,500 |
| 2019 | $6,481 | $278,500 | $0 | $278,500 |
| 2018 | $5,365 | $195,100 | $0 | $195,100 |
| 2017 | $5,223 | $195,100 | $0 | $195,100 |
| 2016 | $5,119 | $195,100 | $0 | $195,100 |
| 2015 | $4,983 | $195,100 | $0 | $195,100 |
| 2014 | $5,076 | $194,800 | $0 | $194,800 |
| 2013 | $5,071 | $194,800 | $0 | $194,800 |
| 2011 | $4,925 | $194,800 | $0 | $194,800 |
Source: Public Records
Map
Nearby Homes
- 8 Thistle Way
- 50 Brookside Dr Unit J1
- 50 Brookside Dr Unit 7
- 50 Brookside Dr Unit F2
- 50 Brookside Dr Unit J-8
- 25 Carroll St
- 81 Front St Unit 6
- 81 Front St Unit 3
- 81 Front St Unit 5
- 5 Brookside Dr Unit 9
- 4 Brookside Dr Unit 10
- 196 Water St Unit 18
- 32 Willey Creek Rd Unit 303
- 12 Little River Rd Unit 7
- 16 Little River Rd Unit 1
- 18 Little River Rd Unit LOT 3
- 50 Linden St
- 163 Water St Unit B2
- 163 Water St Unit A1
- 39 Ernest Ave Unit 303
Your Personal Tour Guide
Ask me questions while you tour the home.