Estimated Value: $509,130 - $560,000
4
Beds
2
Baths
890
Sq Ft
$595/Sq Ft
Est. Value
About This Home
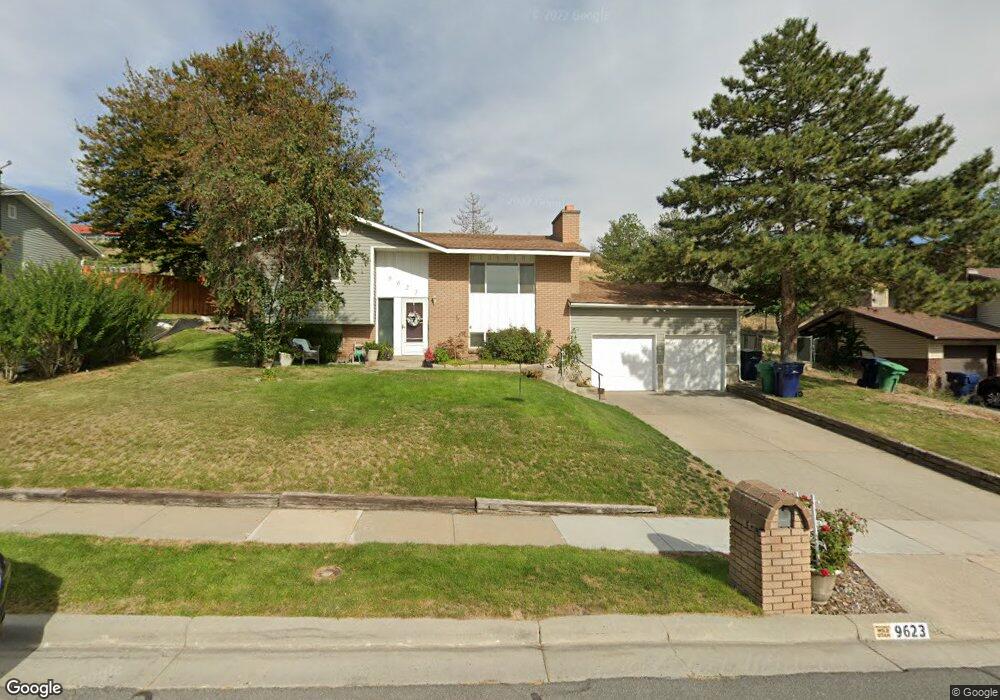
This home is located at 9623 S 1210 E, Sandy, UT 84094 and is currently estimated at $529,533, approximately $594 per square foot. 9623 S 1210 E is a home located in Salt Lake County with nearby schools including Eastmont Middle School, Jordan High, and The Waterford School.
Ownership History
Date
Name
Owned For
Owner Type
Purchase Details
Closed on
Jun 7, 2019
Sold by
Tonel Mario L and Baar Barbara L
Bought by
Baar Tonel Mario and Baar Tonel Barbara
Current Estimated Value
Home Financials for this Owner
Home Financials are based on the most recent Mortgage that was taken out on this home.
Original Mortgage
$281,084
Outstanding Balance
$248,614
Interest Rate
4.4%
Mortgage Type
FHA
Estimated Equity
$280,919
Purchase Details
Closed on
Sep 6, 2016
Sold by
Tonel Mario L
Bought by
Tonel Mario L and Baar Barbara L
Home Financials for this Owner
Home Financials are based on the most recent Mortgage that was taken out on this home.
Original Mortgage
$227,306
Interest Rate
3.45%
Mortgage Type
FHA
Purchase Details
Closed on
Dec 15, 1994
Sold by
Fisk Ken William and Fisk Deborah M
Bought by
Sprague Robert Alan and Sprague Susan Culver
Home Financials for this Owner
Home Financials are based on the most recent Mortgage that was taken out on this home.
Original Mortgage
$110,625
Interest Rate
9.1%
Create a Home Valuation Report for This Property
The Home Valuation Report is an in-depth analysis detailing your home's value as well as a comparison with similar homes in the area
Home Values in the Area
Average Home Value in this Area
Purchase History
| Date | Buyer | Sale Price | Title Company |
|---|---|---|---|
| Baar Tonel Mario | -- | Old Republic Title | |
| Tonel Mario L | -- | Accommodation | |
| Tonel Mario L | -- | Metro National Title | |
| Sprague Robert Alan | -- | -- |
Source: Public Records
Mortgage History
| Date | Status | Borrower | Loan Amount |
|---|---|---|---|
| Open | Baar Tonel Mario | $281,084 | |
| Closed | Tonel Mario L | $227,306 | |
| Previous Owner | Sprague Robert Alan | $110,625 |
Source: Public Records
Tax History
| Year | Tax Paid | Tax Assessment Tax Assessment Total Assessment is a certain percentage of the fair market value that is determined by local assessors to be the total taxable value of land and additions on the property. | Land | Improvement |
|---|---|---|---|---|
| 2025 | $2,419 | $479,700 | $121,100 | $358,600 |
| 2024 | $2,419 | $463,800 | $113,200 | $350,600 |
| 2023 | $2,126 | $400,800 | $107,600 | $293,200 |
| 2022 | $2,230 | $410,700 | $105,500 | $305,200 |
| 2021 | $1,937 | $304,100 | $82,000 | $222,100 |
| 2020 | $1,883 | $278,900 | $82,000 | $196,900 |
| 2019 | $1,783 | $257,500 | $77,400 | $180,100 |
| 2016 | $1,474 | $205,500 | $77,400 | $128,100 |
Source: Public Records
Map
Nearby Homes
- 9633 S 1210 E
- 1105 E Webster Dr
- 9587 S 1040 E
- 1469 Winterwood Cir
- 9976 Tamara St E
- 9968 S Blossom Dr
- 1492 E Sandy Hills Dr
- 1242 Earl Way
- 1563 E Tameron Dr
- 1584 Petunia Way
- 9828 Pinehurst Dr
- 9971 Pinehurst Dr
- 1123 E Sego Lily Dr
- 9979 S Albury Rd
- 1650 E Budding Dr
- 1138 E Quarry Stone Way
- 10172 Snow Iris Way
- 1482 Waters Ln
- 918 Lazon Dr
- 9218 S Laura Anne Way
- 9613 S 1210 E
- 1219 Elswood Ave
- 9593 S 1210 E
- 1219 E Elswood Ave
- 9624 S 1210 E
- 9634 S 1210 E
- 1201 Elswood Ave
- 9623 Mumford Dr
- 9613 Mumford Dr
- 9584 S 1210 E
- 9633 Mumford Dr
- 1218 Elswood Ave
- 9593 Mumford Dr
- 9571 S 1210 E
- 9643 Mumford Dr
- 1202 Elswood Ave
- 9572 S 1210 E
- 9583 Mumford Dr
- 9583 S Mumford Dr
- 9673 S 1210 E
Your Personal Tour Guide
Ask me questions while you tour the home.