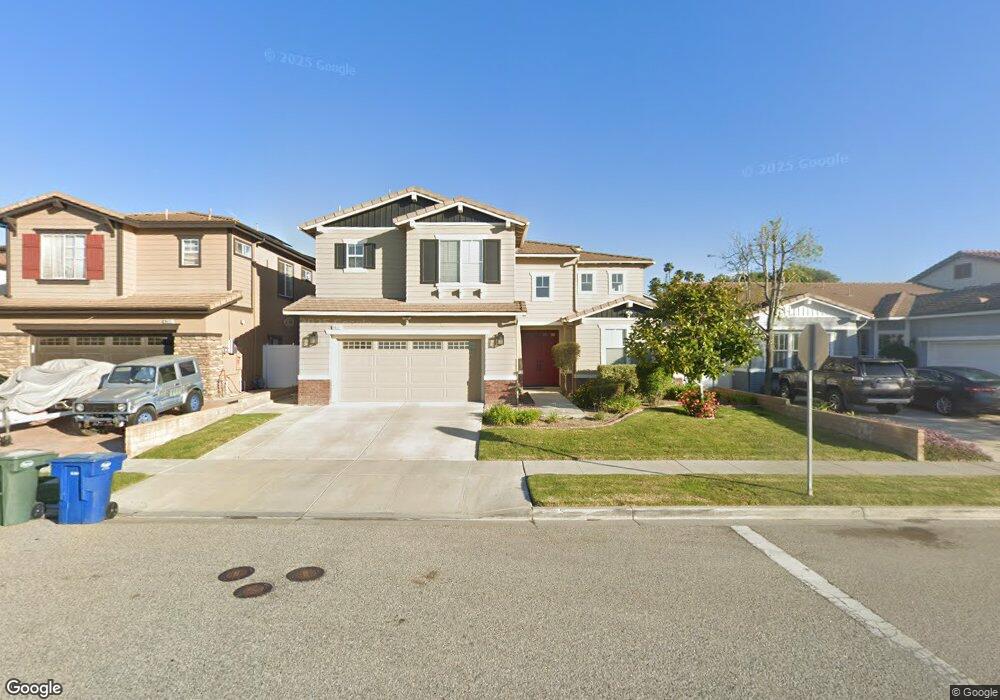
9627 Chamberlain St Ventura, CA 93004
Serra NeighborhoodEstimated Value: $1,180,198 - $1,347,000
4
Beds
3
Baths
3,288
Sq Ft
$389/Sq Ft
Est. Value
About This Home
This home is located at 9627 Chamberlain St, Ventura, CA 93004 and is currently estimated at $1,278,550, approximately $388 per square foot. 9627 Chamberlain St is a home located in Ventura County with nearby schools including Junipero Serra Elementary School, Balboa Middle School, and Buena High School.
Ownership History
Date
Name
Owned For
Owner Type
Purchase Details
Closed on
Jul 23, 2012
Sold by
Quintanar Ruben and Quintanar Theresa
Bought by
Arcangelo Louis F and Arcangelo Patricia A
Current Estimated Value
Home Financials for this Owner
Home Financials are based on the most recent Mortgage that was taken out on this home.
Original Mortgage
$242,000
Outstanding Balance
$165,619
Interest Rate
3.49%
Mortgage Type
New Conventional
Estimated Equity
$1,112,931
Purchase Details
Closed on
May 28, 2003
Sold by
Standard Pacific Corp
Bought by
Quintanar Ruben and Quintanar Theresa
Home Financials for this Owner
Home Financials are based on the most recent Mortgage that was taken out on this home.
Original Mortgage
$342,000
Interest Rate
5.61%
Mortgage Type
Purchase Money Mortgage
Create a Home Valuation Report for This Property
The Home Valuation Report is an in-depth analysis detailing your home's value as well as a comparison with similar homes in the area
Home Values in the Area
Average Home Value in this Area
Purchase History
| Date | Buyer | Sale Price | Title Company |
|---|---|---|---|
| Arcangelo Louis F | $590,000 | Chicago Title Company | |
| Quintanar Ruben | $500,000 | Lawyers Title Company |
Source: Public Records
Mortgage History
| Date | Status | Borrower | Loan Amount |
|---|---|---|---|
| Open | Arcangelo Louis F | $242,000 | |
| Previous Owner | Quintanar Ruben | $342,000 |
Source: Public Records
Tax History Compared to Growth
Tax History
| Year | Tax Paid | Tax Assessment Tax Assessment Total Assessment is a certain percentage of the fair market value that is determined by local assessors to be the total taxable value of land and additions on the property. | Land | Improvement |
|---|---|---|---|---|
| 2025 | $8,641 | $726,410 | $363,206 | $363,204 |
| 2024 | $8,641 | $712,167 | $356,084 | $356,083 |
| 2023 | $8,522 | $698,203 | $349,102 | $349,101 |
| 2022 | $7,947 | $684,513 | $342,257 | $342,256 |
| 2021 | $7,757 | $671,092 | $335,546 | $335,546 |
| 2020 | $7,547 | $664,212 | $332,106 | $332,106 |
| 2019 | $7,342 | $651,190 | $325,595 | $325,595 |
| 2018 | $7,215 | $638,422 | $319,211 | $319,211 |
| 2017 | $7,078 | $625,904 | $312,952 | $312,952 |
| 2016 | $6,950 | $613,632 | $306,816 | $306,816 |
| 2015 | $6,839 | $604,416 | $302,208 | $302,208 |
| 2014 | $6,534 | $592,578 | $296,289 | $296,289 |
Source: Public Records
Map
Nearby Homes
- 9570 Chamberlain St
- 9503 Chamberlain St
- 1675 Arroyo Seco Dr
- 9182 Halifax St
- 10134 Carlyle St
- 9050 Feather St
- 1534 Pyramid Ave
- 1233 Osage Ln
- 10101 Telephone Rd
- 8983 Aberdare St
- 918 Ann Arbor Ave
- 919 Greensboro Rd
- 814 Danbury Ct
- 10488 Mammoth St
- 901 Decatur Ave
- 1531 Daphne Ave
- 650 Charleston Place
- 922 Olympia Ave
- 10265 Darling Rd
- 10041 Norwalk St
- 9639 Chamberlain St
- 9613 Chamberlain St
- 9653 Chamberlain St
- 9601 Chamberlain St
- 9640 Chamberlain St
- 9667 Chamberlain St
- 9593 Chamberlain St
- 9579 Chamberlain St
- 9606 Chamberlain St
- 9654 Chamberlain St
- 9602 Lucerne St
- 9598 Chamberlain St
- 9681 Chamberlain St
- 9626 Lucerne St
- 9586 Lucerne St
- 9668 Chamberlain St
- 9638 Lucerne St
- 9574 Lucerne St
- 9584 Chamberlain St
- 9682 Chamberlain St