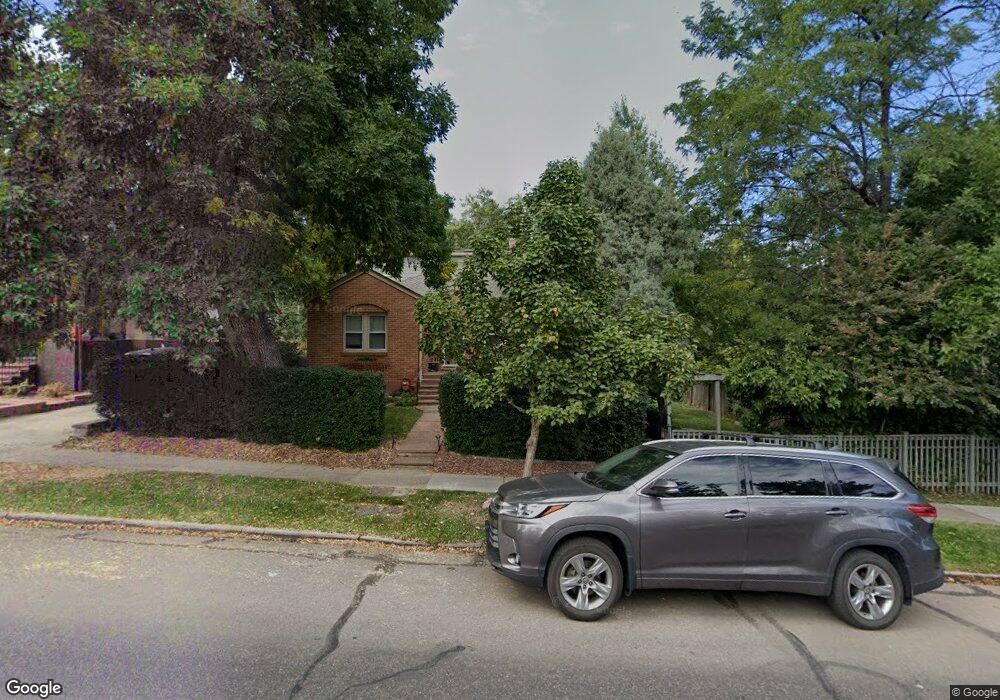
963 9th St Unit 965 Boulder, CO 80302
University Hill NeighborhoodEstimated Value: $1,501,666 - $2,402,000
4
Beds
3
Baths
2,045
Sq Ft
$926/Sq Ft
Est. Value
About This Home
This home is located at 963 9th St Unit 965, Boulder, CO 80302 and is currently estimated at $1,893,917, approximately $926 per square foot. 963 9th St Unit 965 is a home located in Boulder County with nearby schools including Flatirons Elementary School, Manhattan Middle School of the Arts & Academics, and Boulder High School.
Ownership History
Date
Name
Owned For
Owner Type
Purchase Details
Closed on
Aug 5, 2009
Sold by
Witkovich Paul A
Bought by
Young Melanie K
Current Estimated Value
Purchase Details
Closed on
Dec 19, 2008
Sold by
Young Melanie K
Bought by
Young Melanie K
Home Financials for this Owner
Home Financials are based on the most recent Mortgage that was taken out on this home.
Original Mortgage
$290,000
Interest Rate
5.21%
Mortgage Type
New Conventional
Purchase Details
Closed on
Jul 27, 2000
Sold by
Young Wesley E and Young Nina P
Bought by
Young Melanie K
Purchase Details
Closed on
Feb 10, 1992
Bought by
Young Melanie K
Purchase Details
Closed on
Jun 18, 1990
Bought by
Young Melanie K
Purchase Details
Closed on
Nov 9, 1982
Bought by
Young Melanie K
Create a Home Valuation Report for This Property
The Home Valuation Report is an in-depth analysis detailing your home's value as well as a comparison with similar homes in the area
Home Values in the Area
Average Home Value in this Area
Purchase History
| Date | Buyer | Sale Price | Title Company |
|---|---|---|---|
| Young Melanie K | -- | None Available | |
| Young Melanie K | -- | Trg | |
| Young Melanie K | -- | -- | |
| Young Melanie K | -- | -- | |
| Young Melanie K | $142,000 | -- | |
| Young Melanie K | $113,000 | -- |
Source: Public Records
Mortgage History
| Date | Status | Borrower | Loan Amount |
|---|---|---|---|
| Previous Owner | Young Melanie K | $290,000 |
Source: Public Records
Tax History
| Year | Tax Paid | Tax Assessment Tax Assessment Total Assessment is a certain percentage of the fair market value that is determined by local assessors to be the total taxable value of land and additions on the property. | Land | Improvement |
|---|---|---|---|---|
| 2025 | $9,258 | $104,312 | $89,831 | $14,481 |
| 2024 | $9,258 | $104,312 | $89,831 | $14,481 |
| 2023 | $9,097 | $105,344 | $92,554 | $16,475 |
| 2022 | $8,288 | $89,245 | $78,424 | $10,821 |
| 2021 | $7,903 | $91,814 | $80,681 | $11,133 |
| 2020 | $7,538 | $86,601 | $69,284 | $17,317 |
| 2019 | $7,423 | $86,601 | $69,284 | $17,317 |
| 2018 | $6,677 | $77,011 | $49,032 | $27,979 |
| 2017 | $6,468 | $85,141 | $54,208 | $30,933 |
| 2016 | $5,685 | $65,670 | $32,716 | $32,954 |
| 2015 | $5,383 | $55,179 | $25,154 | $30,025 |
| 2014 | $4,640 | $55,179 | $25,154 | $30,025 |
Source: Public Records
Map
Nearby Homes
- 964 Grant Place
- 1021 9th St
- 911 Lincoln Place
- 1084 Grant Place
- 780 College Ave
- 800 Grant Place
- 1128 Lincoln Place
- 1200 College Ave Unit 118
- 751 Grant Place
- 820 6th St
- 611 Cascade Ave Unit 7
- 920 University Ave
- 505 Geneva Ave
- 851 14th St
- 650 12th St
- 610 University Ave
- 1405 Broadway St Unit 206
- 1405 Broadway St Unit 102
- 715 14th St
- 789 15th St
Your Personal Tour Guide
Ask me questions while you tour the home.