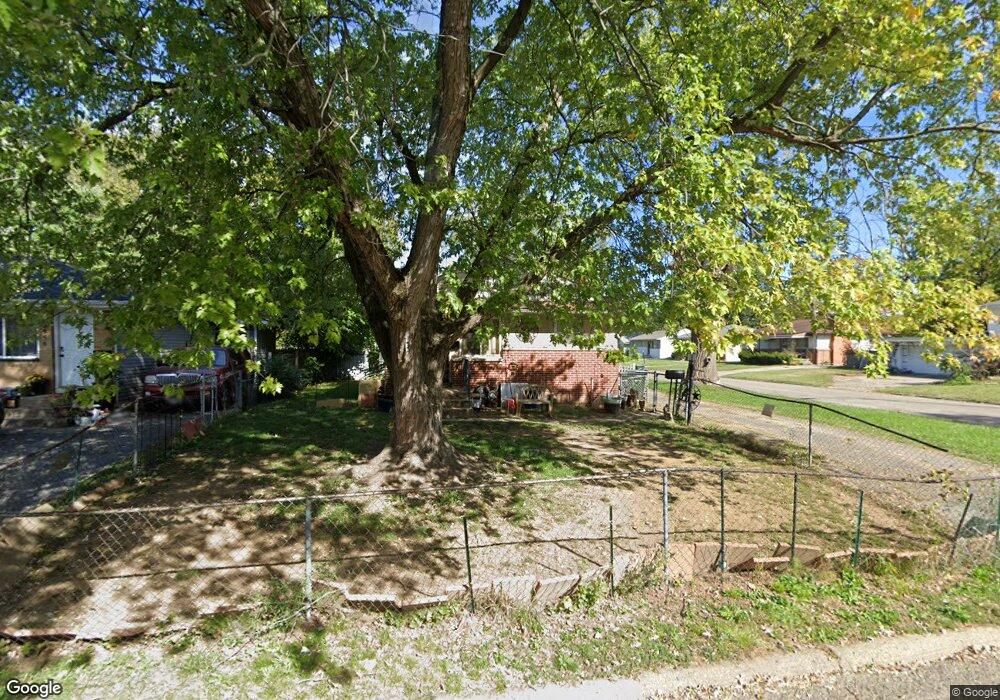
964 Reeb Ave Columbus, OH 43207
Edgewood NeighborhoodEstimated Value: $124,000 - $153,000
3
Beds
1
Bath
864
Sq Ft
$161/Sq Ft
Est. Value
About This Home
This home is located at 964 Reeb Ave, Columbus, OH 43207 and is currently estimated at $138,982, approximately $160 per square foot. 964 Reeb Ave is a home located in Franklin County with nearby schools including Moler Elementary School, South High School, and Summit Academy Community School-Columbus.
Ownership History
Date
Name
Owned For
Owner Type
Purchase Details
Closed on
May 16, 2014
Sold by
Veliaj Nentor
Bought by
Alpett Properties Llc
Current Estimated Value
Purchase Details
Closed on
Nov 18, 2011
Sold by
Secretary Of Housing & Urban Development
Bought by
Veliaj Nentor
Purchase Details
Closed on
Apr 7, 2011
Sold by
The Bank Of New York Mellon
Bought by
Department Of Housing & Urban Developmen
Purchase Details
Closed on
Sep 30, 2010
Sold by
Coleman Rhea and Case #08 Cve 11 16516
Bought by
The Bank Of New York Mellon and Jpmorgan Chase Bank National Association
Purchase Details
Closed on
Nov 18, 1997
Sold by
Fcms Reo Sub Corp
Bought by
Coleman Rhea
Home Financials for this Owner
Home Financials are based on the most recent Mortgage that was taken out on this home.
Original Mortgage
$41,300
Interest Rate
7.38%
Mortgage Type
FHA
Purchase Details
Closed on
May 29, 1997
Sold by
Transamerica Financial Services Company
Bought by
Fcms Reo Sub Corp
Create a Home Valuation Report for This Property
The Home Valuation Report is an in-depth analysis detailing your home's value as well as a comparison with similar homes in the area
Home Values in the Area
Average Home Value in this Area
Purchase History
| Date | Buyer | Sale Price | Title Company |
|---|---|---|---|
| Alpett Properties Llc | $30,000 | None Available | |
| Veliaj Nentor | $14,400 | None Available | |
| Department Of Housing & Urban Developmen | -- | Attorney | |
| The Bank Of New York Mellon | $44,000 | Attorney | |
| Coleman Rhea | $31,000 | Stewart Title Agency Of Colu | |
| Fcms Reo Sub Corp | $22,100 | -- |
Source: Public Records
Mortgage History
| Date | Status | Borrower | Loan Amount |
|---|---|---|---|
| Previous Owner | Coleman Rhea | $41,300 |
Source: Public Records
Tax History
| Year | Tax Paid | Tax Assessment Tax Assessment Total Assessment is a certain percentage of the fair market value that is determined by local assessors to be the total taxable value of land and additions on the property. | Land | Improvement |
|---|---|---|---|---|
| 2025 | $2,340 | $51,070 | $13,200 | $37,870 |
| 2024 | $2,340 | $51,070 | $13,200 | $37,870 |
| 2023 | $2,311 | $51,065 | $13,195 | $37,870 |
| 2022 | $1,036 | $19,500 | $5,670 | $13,830 |
| 2021 | $1,038 | $19,500 | $5,670 | $13,830 |
| 2020 | $1,040 | $19,500 | $5,670 | $13,830 |
| 2019 | $1,002 | $16,110 | $4,730 | $11,380 |
| 2018 | $1,045 | $16,110 | $4,730 | $11,380 |
| 2017 | $1,002 | $16,110 | $4,730 | $11,380 |
| 2016 | $1,116 | $16,420 | $4,970 | $11,450 |
| 2015 | $1,091 | $16,420 | $4,970 | $11,450 |
| 2014 | $990 | $16,420 | $4,970 | $11,450 |
| 2013 | $513 | $17,255 | $5,215 | $12,040 |
Source: Public Records
Map
Nearby Homes
- 990 Reeb Ave
- 941 Lawrence Dr Unit 943
- 1019 Lawrence Dr
- 1739 Linwood Ave
- 1723 S Champion Ave
- 1172 E Woodrow Ave
- 69 E Woodrow Ave
- 782 Stambaugh Ave
- 1575 S Champion Ave
- 1568 Oakwood Ave
- 1571 Wilson Ave
- 1283 E Innis Ave
- 1718 Weiler Ave
- 868 Lawndale Ave
- 1514-1518 Wilson Ave
- 818 Lawndale Ave
- 1472 S Champion Ave
- 2441 Wilson Ave
- 546 Stambaugh Ave
- 605 Southwood Ave
Your Personal Tour Guide
Ask me questions while you tour the home.