
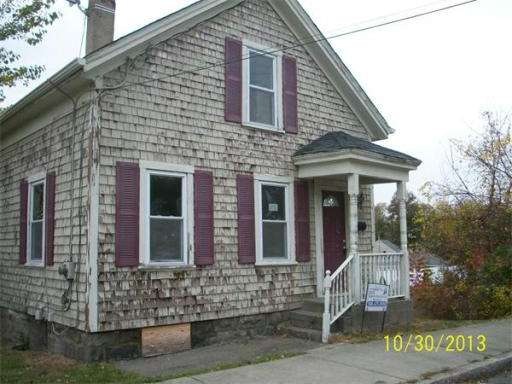
965 Bay St Fall River, MA 02724
Sandy Beach NeighborhoodEstimated Value: $183,000 - $317,000
2
Beds
1
Bath
853
Sq Ft
$320/Sq Ft
Est. Value
About This Home
As of January 2014Sold at auction
Last Agent to Sell the Property
Roberts Associates Real Estate Listed on: 01/29/2014
Ownership History
Date
Name
Owned For
Owner Type
Purchase Details
Closed on
Jun 18, 2013
Sold by
Boidi Elaine R
Bought by
Federal National Mortgage Association
Total Days on Market
0
Current Estimated Value
Purchase Details
Closed on
Jun 8, 2007
Sold by
Pizzarella Anne
Bought by
Boidi Elaine R
Home Financials for this Owner
Home Financials are based on the most recent Mortgage that was taken out on this home.
Original Mortgage
$160,000
Interest Rate
6.17%
Mortgage Type
Purchase Money Mortgage
Purchase Details
Closed on
Feb 20, 2003
Sold by
Martin Esther
Bought by
Pizzarella Anne
Home Financials for this Owner
Home Financials are based on the most recent Mortgage that was taken out on this home.
Original Mortgage
$72,800
Interest Rate
5.98%
Mortgage Type
Purchase Money Mortgage
Similar Homes in Fall River, MA
Create a Home Valuation Report for This Property
The Home Valuation Report is an in-depth analysis detailing your home's value as well as a comparison with similar homes in the area
Home Values in the Area
Average Home Value in this Area
Purchase History
| Date | Buyer | Sale Price | Title Company |
|---|---|---|---|
| Federal National Mortgage Association | $204,629 | -- | |
| Boidi Elaine R | -- | -- | |
| Pizzarella Anne | $91,000 | -- |
Source: Public Records
Mortgage History
| Date | Status | Borrower | Loan Amount |
|---|---|---|---|
| Open | Burgess Jacob | $64,000 | |
| Previous Owner | Boidi Elaine R | $160,000 | |
| Previous Owner | Pizzarella Anne | $72,800 |
Source: Public Records
Property History
| Date | Event | Price | Change | Sq Ft Price |
|---|---|---|---|---|
| 01/29/2014 01/29/14 | Sold | $40,000 | 0.0% | $47 / Sq Ft |
| 01/29/2014 01/29/14 | For Sale | $40,000 | -- | $47 / Sq Ft |
Source: MLS Property Information Network (MLS PIN)
Tax History Compared to Growth
Tax History
| Year | Tax Paid | Tax Assessment Tax Assessment Total Assessment is a certain percentage of the fair market value that is determined by local assessors to be the total taxable value of land and additions on the property. | Land | Improvement |
|---|---|---|---|---|
| 2025 | $1,976 | $172,600 | $105,300 | $67,300 |
| 2024 | $1,883 | $163,900 | $101,500 | $62,400 |
| 2023 | $1,698 | $138,400 | $83,800 | $54,600 |
| 2022 | $1,615 | $128,000 | $79,800 | $48,200 |
| 2021 | $1,579 | $114,200 | $76,000 | $38,200 |
| 2020 | $1,610 | $111,400 | $74,900 | $36,500 |
| 2019 | $1,554 | $106,600 | $72,100 | $34,500 |
| 2018 | $1,633 | $111,700 | $78,100 | $33,600 |
| 2017 | $1,508 | $107,700 | $74,400 | $33,300 |
| 2016 | $1,509 | $110,700 | $79,200 | $31,500 |
| 2015 | $1,844 | $141,000 | $79,200 | $61,800 |
| 2014 | $1,744 | $138,600 | $76,800 | $61,800 |
Source: Public Records
Agents Affiliated with this Home
-
Charles Roberts
C
Seller's Agent in 2014
Charles Roberts
Roberts Associates Real Estate
(401) 741-7933
54 Total Sales
Map
Source: MLS Property Information Network (MLS PIN)
MLS Number: 71627585
APN: FALL-000018H-000000-000012
Disclaimer: Certain information contained herein is derived from information provided by parties other than Homes.com. All information provided is deemed reliable, but is not guaranteed to be accurate and should be independently verified.
![]() The property listing data and information, or the Images, set forth herein were provided to MLS Property Information Network, Inc. from third party sources, including sellers, lessors and public records, and were compiled by MLS Property Information Network, Inc. The property listing data and information, and the Images, are for the personal, non-commercial use of consumers having a good faith interest in purchasing or leasing listed properties of the type displayed to them and may not be used for any purpose other than to identify prospective properties which such consumers may have a good faith interest in purchasing or leasing. MLS Property Information Network, Inc. and its subscribers disclaim any and all representations and warranties as to the accuracy of the property listing data and information, or as to the accuracy of any of the Images, set forth herein.
The property listing data and information, or the Images, set forth herein were provided to MLS Property Information Network, Inc. from third party sources, including sellers, lessors and public records, and were compiled by MLS Property Information Network, Inc. The property listing data and information, and the Images, are for the personal, non-commercial use of consumers having a good faith interest in purchasing or leasing listed properties of the type displayed to them and may not be used for any purpose other than to identify prospective properties which such consumers may have a good faith interest in purchasing or leasing. MLS Property Information Network, Inc. and its subscribers disclaim any and all representations and warranties as to the accuracy of the property listing data and information, or as to the accuracy of any of the Images, set forth herein.
Nearby Homes