Estimated Value: $277,000 - $282,000
2
Beds
2
Baths
1,632
Sq Ft
$171/Sq Ft
Est. Value
About This Home
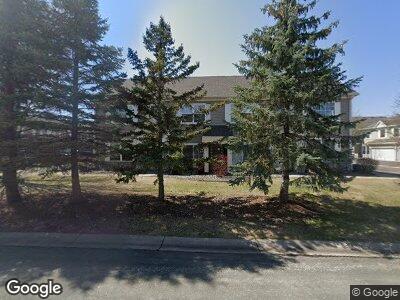
This home is located at 9655 Alvarado Ln N, Osseo, MN 55311 and is currently estimated at $279,305, approximately $171 per square foot. 9655 Alvarado Ln N is a home located in Hennepin County with nearby schools including Rush Creek Elementary School, Maple Grove Middle School, and Maple Grove Senior High School.
Ownership History
Date
Name
Owned For
Owner Type
Purchase Details
Closed on
Oct 4, 2019
Sold by
Schwartz Alexa M
Bought by
Small Todd G
Current Estimated Value
Home Financials for this Owner
Home Financials are based on the most recent Mortgage that was taken out on this home.
Original Mortgage
$157,500
Interest Rate
3.7%
Mortgage Type
New Conventional
Purchase Details
Closed on
May 15, 2015
Sold by
Borcherding Robert K
Bought by
Schwartz Alexa M
Home Financials for this Owner
Home Financials are based on the most recent Mortgage that was taken out on this home.
Original Mortgage
$122,000
Interest Rate
3.62%
Mortgage Type
New Conventional
Purchase Details
Closed on
May 3, 2005
Sold by
Hollinger Daniel W
Bought by
Borcherding Robert K
Purchase Details
Closed on
May 12, 1999
Sold by
Vergin Todd E
Bought by
Hollinger W Daniel
Purchase Details
Closed on
Jul 1, 1998
Sold by
Tradition Ventures Llc
Bought by
The Rottlund Company Inc
Create a Home Valuation Report for This Property
The Home Valuation Report is an in-depth analysis detailing your home's value as well as a comparison with similar homes in the area
Home Values in the Area
Average Home Value in this Area
Purchase History
| Date | Buyer | Sale Price | Title Company |
|---|---|---|---|
| Small Todd G | $210,000 | Burnet Title | |
| Schwartz Alexa M | $152,500 | Edina Realty Title Inc | |
| Borcherding Robert K | $185,000 | -- | |
| Hollinger W Daniel | $128,000 | -- | |
| The Rottlund Company Inc | $7,300 | -- | |
| Vergin Todd E | $116,495 | -- |
Source: Public Records
Mortgage History
| Date | Status | Borrower | Loan Amount |
|---|---|---|---|
| Open | Small Todd G | $162,900 | |
| Closed | Small Todd G | $157,500 | |
| Previous Owner | Schwartz Alexa M | $122,000 |
Source: Public Records
Tax History Compared to Growth
Tax History
| Year | Tax Paid | Tax Assessment Tax Assessment Total Assessment is a certain percentage of the fair market value that is determined by local assessors to be the total taxable value of land and additions on the property. | Land | Improvement |
|---|---|---|---|---|
| 2023 | $3,095 | $273,800 | $69,200 | $204,600 |
| 2022 | $2,460 | $241,400 | $36,000 | $205,400 |
| 2021 | $2,282 | $217,300 | $26,600 | $190,700 |
| 2020 | $2,192 | $200,500 | $28,900 | $171,600 |
| 2019 | $2,104 | $185,200 | $29,700 | $155,500 |
| 2018 | $2,057 | $170,300 | $26,500 | $143,800 |
| 2017 | $1,970 | $153,500 | $19,500 | $134,000 |
| 2016 | $1,950 | $150,500 | $22,500 | $128,000 |
| 2015 | $1,936 | $146,200 | $28,500 | $117,700 |
| 2014 | -- | $122,500 | $18,000 | $104,500 |
Source: Public Records
Map
Nearby Homes
- 9567 Alvarado Ln N
- 18869 97th Place N
- 9694 Winslow Chase N
- 18690 97th Place N
- 18602 97th Place N
- 19253 99th Place
- 18534 98th Place N
- 19029 100th Place N
- 19510 103rd Ave
- 19101 101st Place
- 19077 101st Place
- 19086 100th Place N
- 9179 Larkspur Glade
- 18061 96th Ave N
- 18049 96th Ave N
- 9977 Jack Pine Ln
- 9640 Peony Ln N Unit 1208
- 9001 Sawgrass Glen
- 10245 Elm Ln
- 9020 Tewsbury Gate
- 9655 Alvarado Ln N
- 9657 Alvarado Ln N Unit 50
- 9659 Alvarado Ln N
- 9647 9647 Alvarado-Lane-n
- 9649 9649 Alvarado Ln N
- 9647 Alvarado Ln N
- 9645 Alvarado Ln N Unit 53
- 9653 Alvarado Ln N
- 9621 Alvarado Ln N Unit 64
- 9617 Alvarado Ln N Unit 62
- 9623 Alvarado Ln N Unit 60
- 9627 Alvarado Ln N Unit 58
- 9629 Alvarado Ln N
- 9669 Alvarado Ln N
- 9673 Alvarado Ln N
- 9673 Alvarado Ln N Unit 44
- 9669 Alvarado Ln N Unit 47
- 9615 Alvarado Ln N Unit 61
- 9625 Alvarado Ln N Unit 59
- 9671 Alvarado Ln N