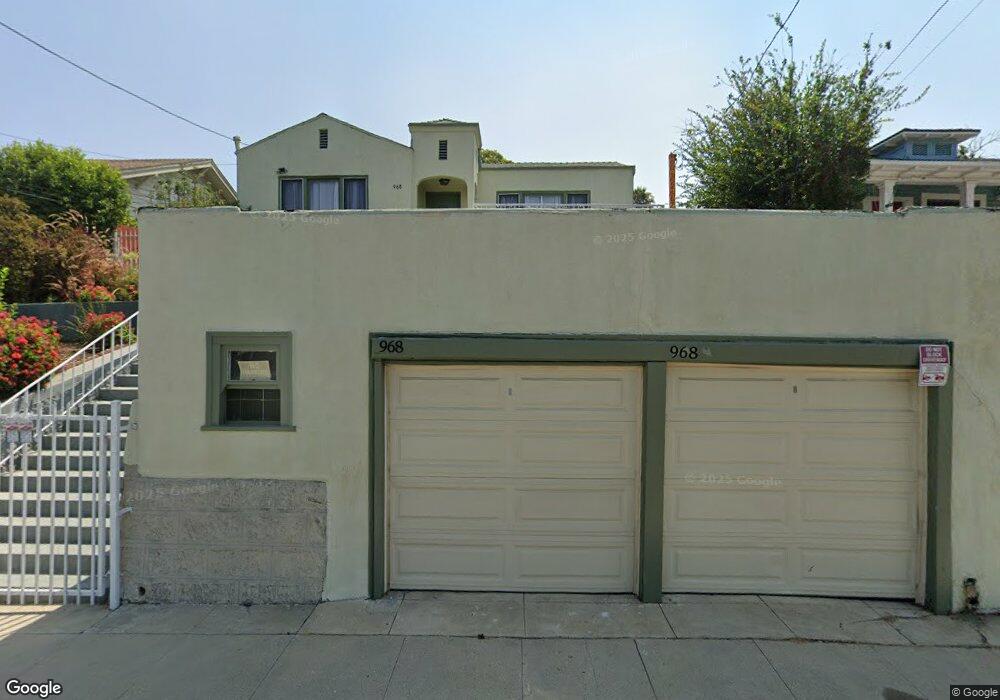
968 Hyperion Ave Los Angeles, CA 90029
Silver Lake NeighborhoodEstimated Value: $1,083,000 - $1,674,047
2
Beds
2
Baths
1,350
Sq Ft
$984/Sq Ft
Est. Value
About This Home
This home is located at 968 Hyperion Ave, Los Angeles, CA 90029 and is currently estimated at $1,328,262, approximately $983 per square foot. 968 Hyperion Ave is a home located in Los Angeles County with nearby schools including Lockwood Avenue Elementary School, Thomas Starr King Middle School Film and Media Magnet, and John Marshall Senior High.
Ownership History
Date
Name
Owned For
Owner Type
Purchase Details
Closed on
Nov 18, 2019
Sold by
Astalis John
Bought by
Quintana Mary Ann
Current Estimated Value
Home Financials for this Owner
Home Financials are based on the most recent Mortgage that was taken out on this home.
Original Mortgage
$585,000
Outstanding Balance
$516,177
Interest Rate
3.75%
Mortgage Type
New Conventional
Estimated Equity
$812,085
Purchase Details
Closed on
Jun 6, 2002
Sold by
Hsu Mingya
Bought by
Astalis John
Home Financials for this Owner
Home Financials are based on the most recent Mortgage that was taken out on this home.
Original Mortgage
$250,000
Interest Rate
9.25%
Purchase Details
Closed on
Jul 27, 1995
Sold by
Yu Hilda B F
Bought by
Hsu Mingya
Home Financials for this Owner
Home Financials are based on the most recent Mortgage that was taken out on this home.
Original Mortgage
$66,000
Interest Rate
7.61%
Create a Home Valuation Report for This Property
The Home Valuation Report is an in-depth analysis detailing your home's value as well as a comparison with similar homes in the area
Home Values in the Area
Average Home Value in this Area
Purchase History
| Date | Buyer | Sale Price | Title Company |
|---|---|---|---|
| Quintana Mary Ann | $780,000 | Lawyers Title Company | |
| Astalis John | -- | Chicago Title Co | |
| Hsu Mingya | $95,000 | Progressive Title Company |
Source: Public Records
Mortgage History
| Date | Status | Borrower | Loan Amount |
|---|---|---|---|
| Open | Quintana Mary Ann | $585,000 | |
| Previous Owner | Astalis John | $250,000 | |
| Previous Owner | Hsu Mingya | $66,000 | |
| Closed | Hsu Mingya | $5,250 |
Source: Public Records
Tax History Compared to Growth
Tax History
| Year | Tax Paid | Tax Assessment Tax Assessment Total Assessment is a certain percentage of the fair market value that is determined by local assessors to be the total taxable value of land and additions on the property. | Land | Improvement |
|---|---|---|---|---|
| 2025 | $10,395 | $853,039 | $688,994 | $164,045 |
| 2024 | $10,395 | $836,314 | $675,485 | $160,829 |
| 2023 | $10,196 | $819,917 | $662,241 | $157,676 |
| 2022 | $9,725 | $803,841 | $649,256 | $154,585 |
| 2021 | $9,604 | $788,080 | $636,526 | $151,554 |
| 2020 | $9,699 | $780,000 | $630,000 | $150,000 |
| 2019 | $4,066 | $324,441 | $238,370 | $86,071 |
| 2018 | $3,985 | $318,081 | $233,697 | $84,384 |
| 2017 | $3,898 | $311,845 | $229,115 | $82,730 |
| 2016 | $3,794 | $305,731 | $224,623 | $81,108 |
| 2015 | $3,739 | $301,139 | $221,249 | $79,890 |
| 2014 | $3,763 | $295,242 | $216,916 | $78,326 |
Source: Public Records
Map
Nearby Homes
- 938 Hyperion Ave
- 960 Sanborn Ave Unit 3
- 943 Venango Ave
- 1018 Manzanita St
- 975 Lucile Ave
- 957 Manzanita St
- 967 Lucile Ave
- 3924 W Sunset Blvd
- 823 Hyperion Ave
- 816 Hyperion Ave
- 1118 Sanborn Ave
- 1108 Manzanita St
- 1128 N Commonwealth Ave
- 1145 N Hoover St
- 1127 N Commonwealth Ave
- 1132 Manzanita St
- 3234 Larissa Dr
- 1644 Maltman Ave
- 827 Lucile Ave
- 3324 Hamilton Way
- 968 Hyperion Ave Unit 1/2
- 962 Hyperion Ave
- 972 Hyperion Ave
- 956 Hyperion Ave
- 977 Hyperion Ave
- 978 Hyperion Ave
- 976 Hyperion Ave Unit 1/2
- 976 Hyperion Ave
- 967 Hyperion Ave
- 961 Hyperion Ave
- 982 1/2 Hyperion Ave
- 973 Hyperion Ave
- 952 Hyperion Ave
- 957 Hyperion Ave
- 982 Hyperion Ave
- 951 Hyperion Ave
- 983 Hyperion Ave
- 1369 Lucile Ave
- 1363 Lucile Ave