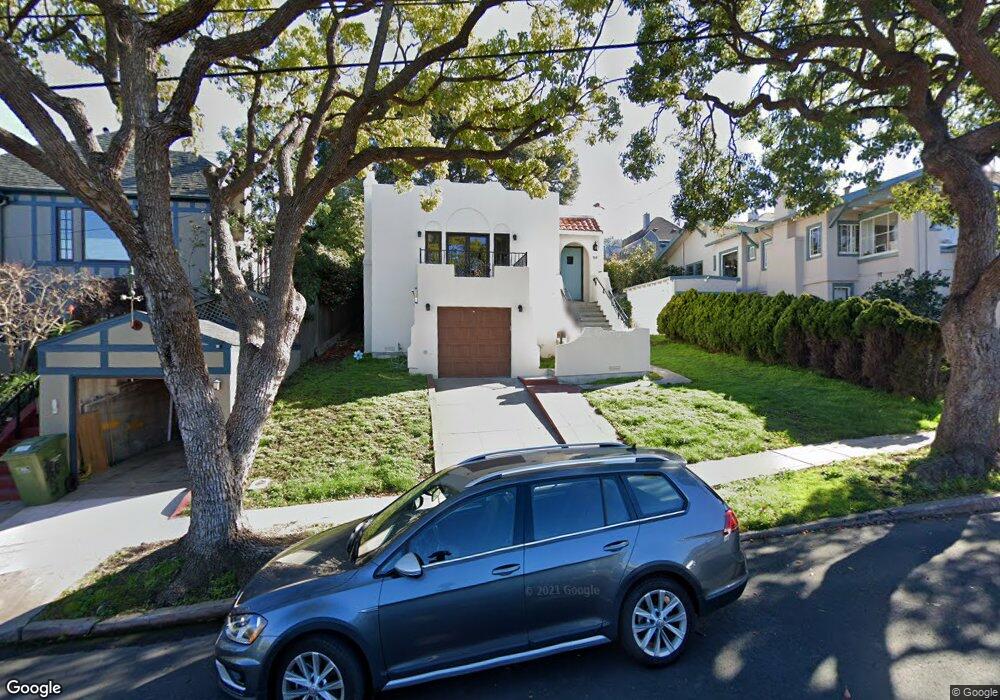
969 Tulare Ave Berkeley, CA 94707
Northbrae NeighborhoodEstimated Value: $1,428,000 - $1,832,000
About This Home
This home is located at 969 Tulare Ave, Berkeley, CA 94707 and is currently estimated at $1,692,100, approximately $1,248 per square foot. 969 Tulare Ave is a home located in Alameda County with nearby schools including Thousand Oaks Elementary School, Ruth Acty Elementary, and Berkeley Arts Magnet at Whittier School.
Ownership History
We collect this data history from publicly available records. To have your information removed, we recommend requesting removal directly through your county’s website.
Purchase Details
Purchase Details
Home Financials for this Owner
Home Financials are based on the most recent Mortgage that was taken out on this home.Purchase Details
Purchase Details
Purchase Details
Home Values in the Area
Average Home Value in this Area
Purchase History
We collect this data history from publicly available records. To have your information removed, we recommend requesting removal directly through your county’s website.
| Date | Buyer | Sale Price | Title Company |
|---|---|---|---|
| -- | None Available | ||
| $1,017,500 | Old Republic Title Company | ||
| -- | None Available | ||
| -- | -- | ||
| -- | -- |
Mortgage History
We collect this data history from publicly available records. To have your information removed, we recommend requesting removal directly through your county’s website.
| Date | Status | Borrower | Loan Amount |
|---|---|---|---|
| Open | $814,000 |
Tax History
We collect this data history from publicly available records. To have your information removed, we recommend requesting removal directly through your county’s website.
| Year | Tax Paid | Tax Assessment Tax Assessment Total Assessment is a certain percentage of the fair market value that is determined by local assessors to be the total taxable value of land and additions on the property. | Land | Improvement |
|---|---|---|---|---|
| 2025 | $17,738 | $1,240,494 | $361,286 | $886,208 |
| 2024 | $17,738 | $1,216,034 | $354,202 | $868,832 |
| 2023 | $17,381 | $1,199,060 | $347,259 | $851,801 |
| 2022 | $17,099 | $1,168,549 | $340,450 | $835,099 |
| 2021 | $17,159 | $1,145,501 | $333,775 | $818,726 |
| 2020 | $16,319 | $1,140,688 | $330,354 | $810,334 |
| 2019 | $15,766 | $1,118,326 | $323,878 | $794,448 |
| 2018 | $15,387 | $1,078,606 | $317,530 | $761,076 |
| 2017 | $14,660 | $1,037,850 | $311,304 | $726,546 |
| 2016 | $2,480 | $71,247 | $46,601 | $24,646 |
| 2015 | $2,429 | $70,177 | $45,901 | $24,276 |
| 2014 | $2,321 | $68,803 | $45,002 | $23,801 |
Map
- 875 Colusa Ave Unit 4
- 1788 San Lorenzo Ave
- 1036 Ramona Ave
- 1858 San Lorenzo Ave
- 1994 Marin Ave
- 899 Arlington Ave
- 664 Vincente Ave
- 844 Ramona Ave
- 1429 Edith St
- 2114 Marin Ave
- 1316 Peralta Ave
- 1340 Henry St
- 1034 Evelyn Ave
- 1425 Martin Luther King jr Way
- 1313 Curtis St
- 1915 Thousand Oaks Blvd
- 1059 Talbot Ave
- 1841 Vine St
- 840 Key Route Blvd
- 1511 Grant St
Ask me questions while you tour the home.