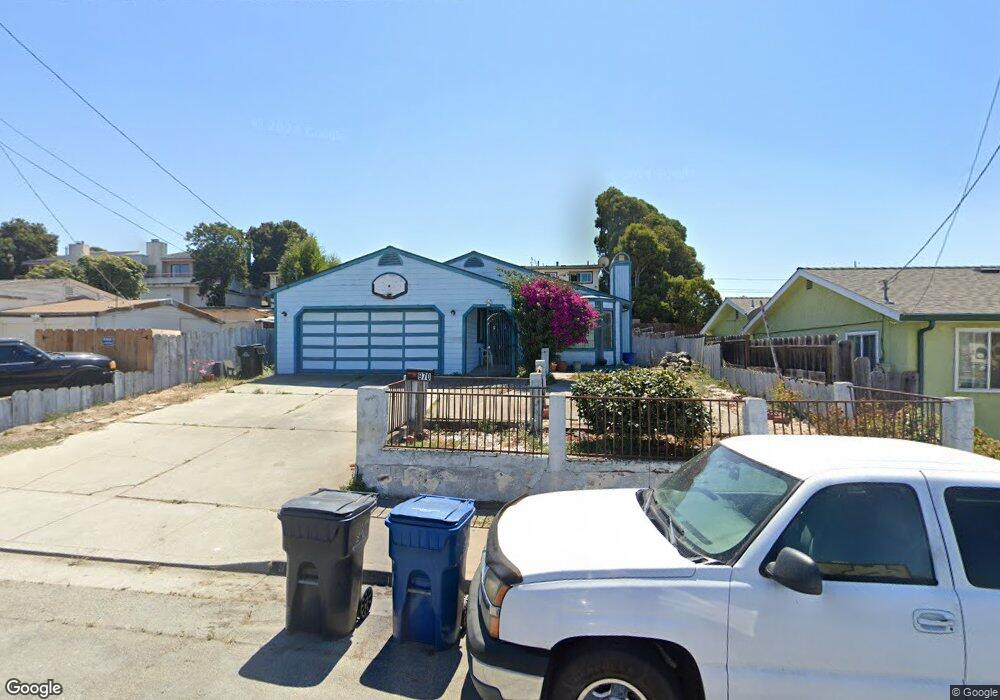
970 Elm Ave Seaside, CA 93955
Estimated Value: $745,000 - $930,000
3
Beds
2
Baths
1,525
Sq Ft
$569/Sq Ft
Est. Value
About This Home
This home is located at 970 Elm Ave, Seaside, CA 93955 and is currently estimated at $866,966, approximately $568 per square foot. 970 Elm Ave is a home located in Monterey County with nearby schools including Highland Elementary School, Seaside Middle School, and Seaside High School.
Ownership History
Date
Name
Owned For
Owner Type
Purchase Details
Closed on
Mar 9, 2004
Sold by
Carreno Alvaro and Carreno Felicitas C
Bought by
Carreno Alvaro and Carreno Felicitas C
Current Estimated Value
Purchase Details
Closed on
Sep 17, 2001
Sold by
Vannguyen Tony and Vanle Em
Bought by
Carreno Alvaro and Ramirez Felicitas C
Home Financials for this Owner
Home Financials are based on the most recent Mortgage that was taken out on this home.
Original Mortgage
$315,200
Outstanding Balance
$136,324
Interest Rate
8.5%
Estimated Equity
$730,642
Purchase Details
Closed on
May 17, 1996
Sold by
Vannguyen Tony Van
Bought by
Vannguyen Tony Van and Vanle En Van
Purchase Details
Closed on
Nov 7, 1995
Sold by
Vannguyen Tony and Vannguyen Thang Van
Bought by
Vannguyen Tony
Home Financials for this Owner
Home Financials are based on the most recent Mortgage that was taken out on this home.
Original Mortgage
$140,000
Interest Rate
7.42%
Purchase Details
Closed on
Mar 16, 1994
Sold by
Do Phuong N
Bought by
Vanle Em Van and Vannguyen Thang Van
Create a Home Valuation Report for This Property
The Home Valuation Report is an in-depth analysis detailing your home's value as well as a comparison with similar homes in the area
Home Values in the Area
Average Home Value in this Area
Purchase History
| Date | Buyer | Sale Price | Title Company |
|---|---|---|---|
| Carreno Alvaro | -- | Fidelity Title | |
| Carreno Alvaro | $394,000 | Chicago Title Co | |
| Vannguyen Tony Van | -- | -- | |
| Vannguyen Tony | -- | American Title Ins Co | |
| Vanle Em Van | -- | -- |
Source: Public Records
Mortgage History
| Date | Status | Borrower | Loan Amount |
|---|---|---|---|
| Open | Carreno Alvaro | $315,200 | |
| Previous Owner | Vannguyen Tony | $140,000 | |
| Closed | Carreno Alvaro | $78,800 |
Source: Public Records
Tax History
| Year | Tax Paid | Tax Assessment Tax Assessment Total Assessment is a certain percentage of the fair market value that is determined by local assessors to be the total taxable value of land and additions on the property. | Land | Improvement |
|---|---|---|---|---|
| 2025 | $6,082 | $582,038 | $295,451 | $286,587 |
| 2024 | $6,082 | $570,626 | $289,658 | $280,968 |
| 2023 | $6,073 | $559,438 | $283,979 | $275,459 |
| 2022 | $5,988 | $548,469 | $278,411 | $270,058 |
| 2021 | $5,900 | $537,715 | $272,952 | $264,763 |
| 2020 | $5,677 | $532,203 | $270,154 | $262,049 |
| 2019 | $5,954 | $521,768 | $264,857 | $256,911 |
| 2018 | $5,716 | $511,538 | $259,664 | $251,874 |
| 2017 | $5,174 | $490,000 | $249,000 | $241,000 |
| 2016 | $5,045 | $477,000 | $242,000 | $235,000 |
| 2015 | $4,584 | $433,000 | $220,000 | $213,000 |
| 2014 | $3,718 | $350,000 | $178,000 | $172,000 |
Source: Public Records
Map
Nearby Homes
- 1125 Olympia Ave
- 1212 Trinity Ave Unit 10
- 520 Amador Ave
- 1266 Wanda Ave
- 1713 Goodwin St
- 400 Sonoma Ave
- 1077 Cadiz Ct
- 835 Kimball Ave Unit 43
- 1336 Luxton St
- 1148 San Lucas St
- 1079 Wheeler St
- 1051 Olympic Ln
- 2660 Bay Ave
- 1787 Laguna St
- 1714 Luxton St
- 1206 La Salle Ave Unit 7
- 0 Tioga Ave Unit ML82030096
- 1740 Judson St
- 1609 Darwin St
- 1524 Elm Ave
Your Personal Tour Guide
Ask me questions while you tour the home.