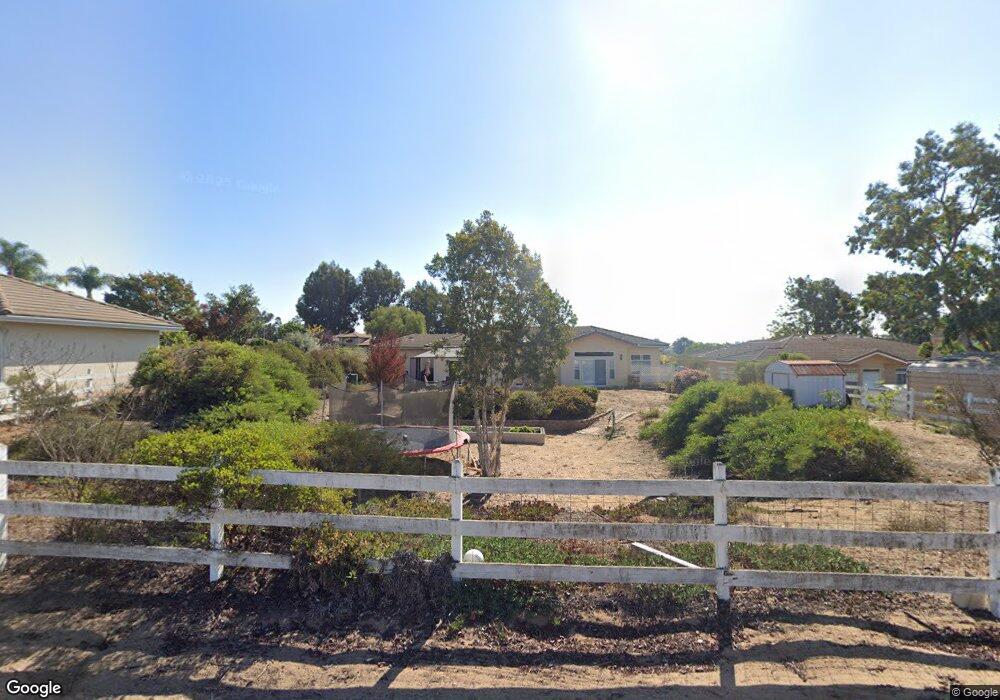
970 Gold Crest Dr Unit 8 Nipomo, CA 93444
Estimated Value: $1,018,000 - $1,242,000
4
Beds
3
Baths
2,386
Sq Ft
$456/Sq Ft
Est. Value
About This Home
This home is located at 970 Gold Crest Dr Unit 8, Nipomo, CA 93444 and is currently estimated at $1,088,467, approximately $456 per square foot. 970 Gold Crest Dr Unit 8 is a home located in San Luis Obispo County with nearby schools including Dana Elementary School, Mesa Middle School, and Nipomo High School.
Ownership History
Date
Name
Owned For
Owner Type
Purchase Details
Closed on
Mar 23, 2022
Sold by
Bruce And Patricia Johnson Family Trust
Bought by
Muguira Moyses and Muguira Traice Michelle
Current Estimated Value
Home Financials for this Owner
Home Financials are based on the most recent Mortgage that was taken out on this home.
Original Mortgage
$805,000
Outstanding Balance
$754,134
Interest Rate
4.16%
Mortgage Type
New Conventional
Estimated Equity
$334,333
Purchase Details
Closed on
Jan 7, 2002
Sold by
Falconcrest Builders Llc
Bought by
Johnson Bruce Allen and Johnson Patricia Morimoto
Home Financials for this Owner
Home Financials are based on the most recent Mortgage that was taken out on this home.
Original Mortgage
$100,000
Interest Rate
7.13%
Create a Home Valuation Report for This Property
The Home Valuation Report is an in-depth analysis detailing your home's value as well as a comparison with similar homes in the area
Home Values in the Area
Average Home Value in this Area
Purchase History
| Date | Buyer | Sale Price | Title Company |
|---|---|---|---|
| Muguira Moyses | $900,000 | First American Title | |
| Johnson Bruce Allen | $407,000 | First American Title |
Source: Public Records
Mortgage History
| Date | Status | Borrower | Loan Amount |
|---|---|---|---|
| Open | Muguira Moyses | $805,000 | |
| Previous Owner | Johnson Bruce Allen | $100,000 |
Source: Public Records
Tax History Compared to Growth
Tax History
| Year | Tax Paid | Tax Assessment Tax Assessment Total Assessment is a certain percentage of the fair market value that is determined by local assessors to be the total taxable value of land and additions on the property. | Land | Improvement |
|---|---|---|---|---|
| 2025 | $9,750 | $955,087 | $424,483 | $530,604 |
| 2024 | $9,637 | $936,360 | $416,160 | $520,200 |
| 2023 | $9,637 | $918,000 | $408,000 | $510,000 |
| 2022 | $5,945 | $566,430 | $194,886 | $371,544 |
| 2021 | $5,933 | $555,324 | $191,065 | $364,259 |
| 2020 | $5,864 | $549,630 | $189,106 | $360,524 |
| 2019 | $5,827 | $538,854 | $185,399 | $353,455 |
| 2018 | $5,756 | $528,289 | $181,764 | $346,525 |
| 2017 | $5,647 | $517,931 | $178,200 | $339,731 |
| 2016 | $5,324 | $507,776 | $174,706 | $333,070 |
| 2015 | $5,247 | $500,149 | $172,082 | $328,067 |
| 2014 | $5,051 | $490,353 | $168,712 | $321,641 |
Source: Public Records
Map
Nearby Homes
- 426 Polaris Dr
- 457 Polaris Dr
- 261 Hazel Ln
- 945 Jeanette Ln
- 393 Uranus Ct
- 1127 Starlite Dr
- 1180 Starlite Dr
- 468 Neptune Dr
- 522 Higos Way
- 840 Story St
- 483 Violet Ave
- 725 Monarch Ln
- 1431 La Loma Dr
- 232 Scarlett Cir
- Mesa Plan at Hill Street Terraces - Hill Street Series
- Pacific Plan at Hill Street Terraces - Hill Street Series
- Monarch Plan at Hill Street Terraces - Hill Street Series
- Rancho Plan at Hill Street Terraces - Hill Street Series
- Dana Plan at Hill Street Terraces - Hill Street Series
- 719 W Tefft St
- 970 Gold Crest Dr
- 980 Gold Crest Dr
- 960 Gold Crest Dr Unit 7
- 960 Gold Crest Dr
- 945 Gold Crest Dr
- 986 Gold Crest Dr
- 988 Gold Crest Dr
- 975 Gold Crest Dr Unit 5
- 975 Gold Crest Dr
- 950 Gold Crest Dr Unit 12
- 950 Gold Crest Dr
- 965 Gold Crest Dr Unit 6
- 965 Gold Crest Dr
- 970 Lisa Ln
- 990 Lisa Ln
- 985 Gold Crest Dr Unit 4
- 985 Gold Crest Dr
- 955 Gold Crest Dr Unit 11
- 955 Gold Crest Dr
- 990 Gold Crest Dr