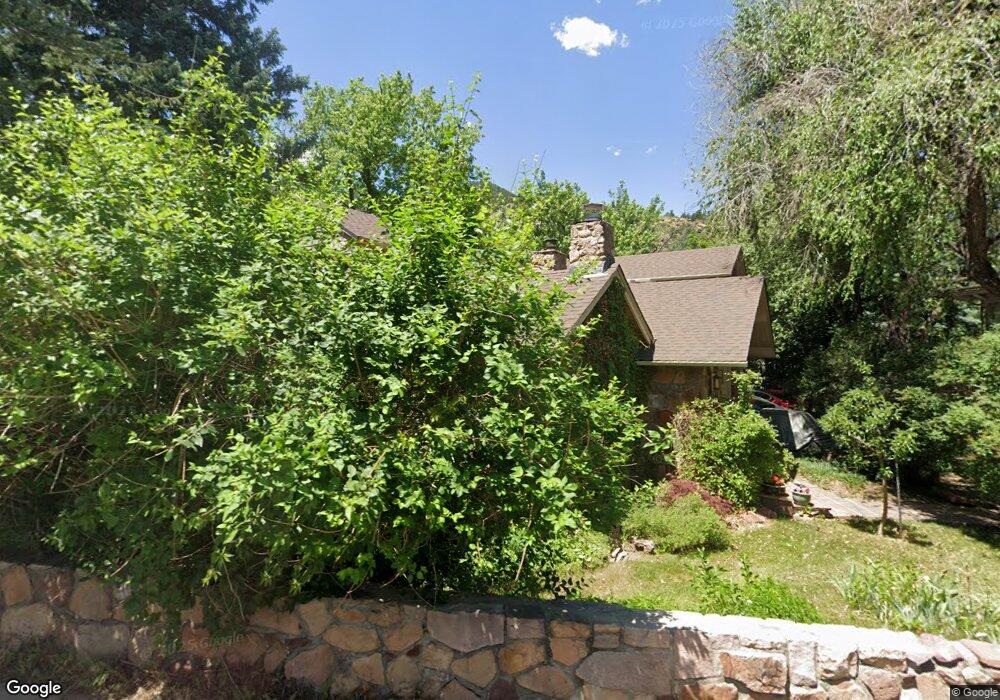
971 6th St Boulder, CO 80302
University Hill NeighborhoodEstimated Value: $2,638,818 - $3,183,000
5
Beds
3
Baths
3,118
Sq Ft
$919/Sq Ft
Est. Value
About This Home
This home is located at 971 6th St, Boulder, CO 80302 and is currently estimated at $2,865,205, approximately $918 per square foot. 971 6th St is a home located in Boulder County with nearby schools including Flatirons Elementary School, Manhattan Middle School of the Arts & Academics, and Boulder High School.
Ownership History
Date
Name
Owned For
Owner Type
Purchase Details
Closed on
Aug 27, 2002
Sold by
Holzman Alene A and Campbell Alene A
Bought by
Campbell Alene A
Current Estimated Value
Home Financials for this Owner
Home Financials are based on the most recent Mortgage that was taken out on this home.
Original Mortgage
$400,000
Outstanding Balance
$168,191
Interest Rate
6.33%
Estimated Equity
$2,697,014
Purchase Details
Closed on
Sep 19, 2000
Sold by
Holzman Alene A and Holzman David L
Bought by
Holzman Alene A
Purchase Details
Closed on
Dec 15, 1997
Sold by
Goddard Faith J Greg and Goddard Jo Anna
Bought by
Holzman Alene A
Home Financials for this Owner
Home Financials are based on the most recent Mortgage that was taken out on this home.
Original Mortgage
$540,000
Interest Rate
7.22%
Purchase Details
Closed on
Nov 29, 1988
Bought by
Campbell Alene A and Campbell Keith S
Purchase Details
Closed on
Aug 19, 1988
Bought by
Campbell Alene A and Campbell Keith S
Purchase Details
Closed on
Feb 11, 1987
Bought by
Campbell Alene A and Campbell Keith S
Create a Home Valuation Report for This Property
The Home Valuation Report is an in-depth analysis detailing your home's value as well as a comparison with similar homes in the area
Home Values in the Area
Average Home Value in this Area
Purchase History
| Date | Buyer | Sale Price | Title Company |
|---|---|---|---|
| Campbell Alene A | -- | -- | |
| Holzman Alene A | -- | -- | |
| Holzman Alene A | $700,000 | Land Title | |
| Campbell Alene A | $340,000 | -- | |
| Campbell Alene A | -- | -- | |
| Campbell Alene A | -- | -- |
Source: Public Records
Mortgage History
| Date | Status | Borrower | Loan Amount |
|---|---|---|---|
| Open | Campbell Alene A | $400,000 | |
| Closed | Holzman Alene A | $540,000 |
Source: Public Records
Tax History
| Year | Tax Paid | Tax Assessment Tax Assessment Total Assessment is a certain percentage of the fair market value that is determined by local assessors to be the total taxable value of land and additions on the property. | Land | Improvement |
|---|---|---|---|---|
| 2025 | $14,692 | $168,369 | $151,532 | $16,837 |
| 2024 | $14,692 | $168,369 | $151,532 | $16,837 |
| 2023 | $14,437 | $173,878 | $159,807 | $17,756 |
| 2022 | $12,733 | $144,060 | $129,654 | $14,406 |
| 2021 | $12,757 | $148,206 | $133,385 | $14,821 |
| 2020 | $12,121 | $139,253 | $111,397 | $27,856 |
| 2019 | $11,936 | $139,253 | $111,397 | $27,856 |
| 2018 | $11,339 | $130,781 | $85,536 | $45,245 |
| 2017 | $10,984 | $144,586 | $94,565 | $50,021 |
| 2016 | $9,706 | $112,125 | $55,959 | $56,166 |
| 2015 | $9,191 | $99,500 | $56,834 | $42,666 |
| 2014 | $8,366 | $99,500 | $56,834 | $42,666 |
Source: Public Records
Map
Nearby Homes
- 505 Geneva Ave
- 820 6th St
- 611 Cascade Ave Unit 7
- 440 Christmas Tree Dr
- 780 College Ave
- 964 Grant Place
- 1021 9th St
- 770 Circle Dr
- 800 Grant Place
- 911 Lincoln Place
- 751 Grant Place
- 610 University Ave
- 1128 Lincoln Place
- 972 Pleasant St
- 920 University Ave
- 623 Marine St
- 465 Marine St
- 1628 4th St
- 839 13th St
- 350 Arapahoe Ave Unit 17
Your Personal Tour Guide
Ask me questions while you tour the home.