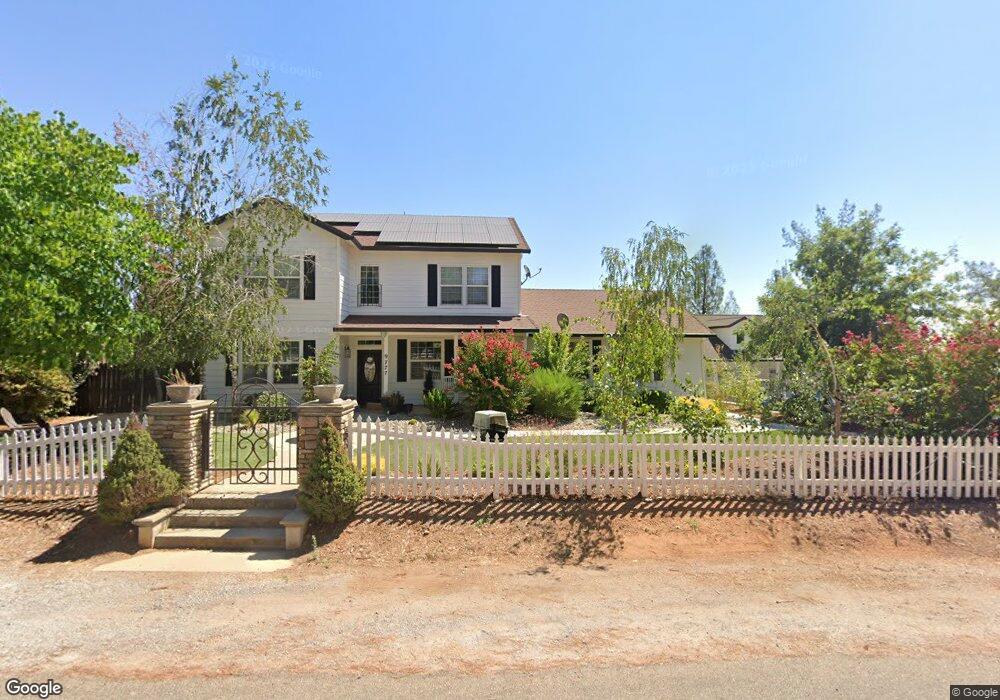
9777 Winegar Rd Redding, CA 96003
Estimated Value: $529,000 - $671,678
3
Beds
3
Baths
2,286
Sq Ft
$264/Sq Ft
Est. Value
About This Home
This home is located at 9777 Winegar Rd, Redding, CA 96003 and is currently estimated at $602,920, approximately $263 per square foot. 9777 Winegar Rd is a home located in Shasta County with nearby schools including Junction Elementary School, Foothill High School, and Chrysalis Charter School.
Ownership History
Date
Name
Owned For
Owner Type
Purchase Details
Closed on
Jan 30, 2007
Sold by
Iron Mesa Llc
Bought by
Burgoyne Olin G and Burgoyne Fawna J
Current Estimated Value
Purchase Details
Closed on
Dec 5, 2006
Sold by
Peters Pat L and Peters Ruth E
Bought by
Iron Mesa Llc
Purchase Details
Closed on
Apr 11, 2006
Sold by
Iron Mesa Llc
Bought by
Peters Pat L and Peters Ruth E
Home Financials for this Owner
Home Financials are based on the most recent Mortgage that was taken out on this home.
Original Mortgage
$215,000
Interest Rate
6.35%
Mortgage Type
Unknown
Purchase Details
Closed on
Mar 22, 2005
Sold by
Bayless Kenneth L and Bayless Lynda
Bought by
Iron Mesa Llc
Create a Home Valuation Report for This Property
The Home Valuation Report is an in-depth analysis detailing your home's value as well as a comparison with similar homes in the area
Purchase History
| Date | Buyer | Sale Price | Title Company |
|---|---|---|---|
| Burgoyne Olin G | $400,000 | Alliance Title Company | |
| Iron Mesa Llc | -- | None Available | |
| Peters Pat L | $265,000 | Chicago Title Co | |
| Iron Mesa Llc | $87,000 | Fidelity Natl Title Co Of Ca |
Source: Public Records
Mortgage History
| Date | Status | Borrower | Loan Amount |
|---|---|---|---|
| Previous Owner | Peters Pat L | $215,000 |
Source: Public Records
Tax History Compared to Growth
Tax History
| Year | Tax Paid | Tax Assessment Tax Assessment Total Assessment is a certain percentage of the fair market value that is determined by local assessors to be the total taxable value of land and additions on the property. | Land | Improvement |
|---|---|---|---|---|
| 2025 | $6,978 | $635,670 | $110,000 | $525,670 |
| 2024 | $6,845 | $622,177 | $110,000 | $512,177 |
| 2023 | $6,845 | $610,910 | $100,000 | $510,910 |
| 2022 | $6,421 | $576,030 | $100,000 | $476,030 |
| 2021 | $5,629 | $502,210 | $85,000 | $417,210 |
| 2020 | $4,555 | $400,000 | $80,000 | $320,000 |
| 2019 | $4,260 | $380,000 | $80,000 | $300,000 |
| 2018 | $4,291 | $366,200 | $80,000 | $286,200 |
| 2017 | $4,252 | $366,200 | $80,000 | $286,200 |
| 2016 | $4,061 | $360,000 | $80,000 | $280,000 |
| 2015 | $3,682 | $335,000 | $75,000 | $260,000 |
| 2014 | $3,475 | $315,000 | $70,000 | $245,000 |
Source: Public Records
Map
Nearby Homes
- 0 Dynasty Ln Unit 26-155
- 10096 Rocking Horse Ln
- 0 Lot13 Unit 2 Ph 2 Stillwater Unit 25-4955
- 0 Tudor Oaks #5 Ave
- 9297 Escondido Ln
- 0 Lot1 Phase2 Stillwater Ranch Unit 25-4951
- 0 Lot2 Phase2 Stillwater Ranch Unit 25-4959
- 0 Lot14 Unit 2 Ph 2 Stillwater Unit 25-4956
- 0 Lot15 Unit 2 Ph 2 Stillwater Unit 25-4957
- 0 Lot12 Unit 2 Ph 2 Stillwater Unit 25-4954
- 0 Lot8 Unit 2 Ph 2 Stillwater Ra Unit 25-4966
- Lot4 Phase2 Stillwater Ranch
- 20822 Clough Creek Rd
- 22215 Grand Estates Dr
- 21774 Oak Meadow Rd
- 10025 Harley Leighton Rd
- 0 Duke Dr
- 21892 Stone Meadows Rd
- 10370 Daystar Way
- 0 Woodview Dr
- 21105 Hackett Ln
- 21116 Hackett Ln
- 21166 Hackett Ln Unit 1
- 0 Hackett Ln
- 9865 Winegar Rd
- 21087 Hackett Ln
- 21066 Hackett Ln
- 21212 Hackett Ln
- 9730 Winegar Rd
- 21092 Hackett 1weup7n136y3
- 9686 Katrick Way
- 21220 Hackett Ln
- 21221 Hackett Ln
- 19689 Katrick Way
- 21092 Hackett Ln
- 9696 Winegar Rd (2 Houses
- 21247 Sandpoint Rd
- 21009 Hackett Ln
- 21282 Tia Mia Ln
- 21282 Tia Mia Ln