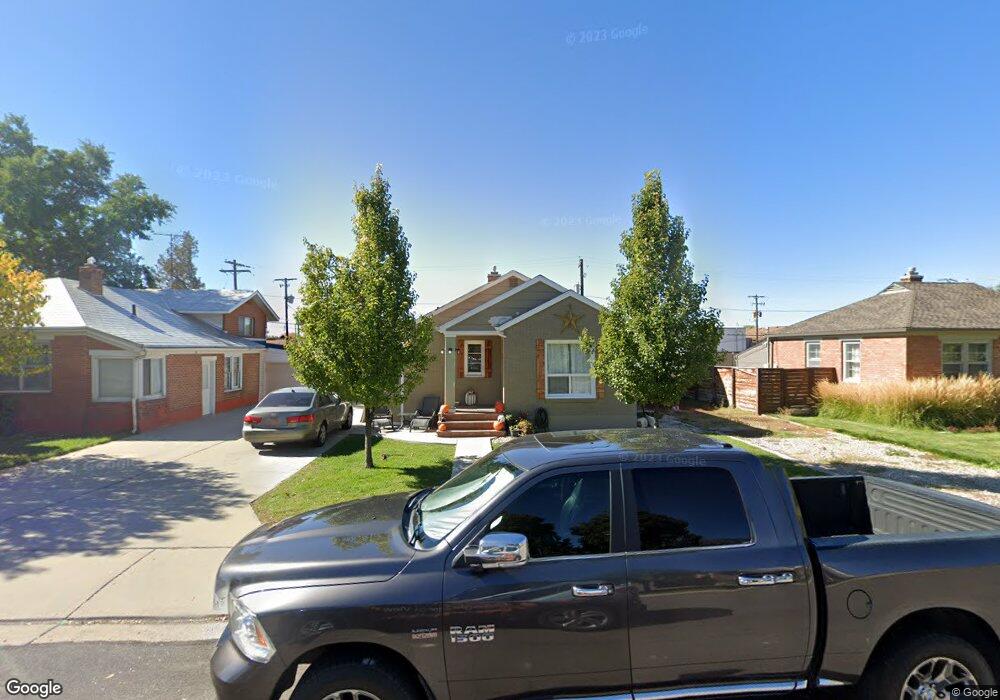
978 S 400 E Orem, UT 84097
Hillcrest NeighborhoodEstimated Value: $394,764 - $517,000
2
Beds
1
Bath
720
Sq Ft
$630/Sq Ft
Est. Value
About This Home
This home is located at 978 S 400 E, Orem, UT 84097 and is currently estimated at $453,441, approximately $629 per square foot. 978 S 400 E is a home located in Utah County with nearby schools including Centennial Elementary, Lakeridge Jr High School, and Orem High School.
Ownership History
Date
Name
Owned For
Owner Type
Purchase Details
Closed on
Mar 21, 2023
Sold by
Fish David A
Bought by
Fish David A and Hall Tiffany A
Current Estimated Value
Home Financials for this Owner
Home Financials are based on the most recent Mortgage that was taken out on this home.
Original Mortgage
$200,000
Outstanding Balance
$193,710
Interest Rate
6.12%
Mortgage Type
Seller Take Back
Estimated Equity
$259,731
Purchase Details
Closed on
May 13, 2022
Sold by
Howard Fish Ted
Bought by
Fish David A
Purchase Details
Closed on
May 9, 2022
Sold by
Howard Fish Ted
Bought by
Fish David A
Purchase Details
Closed on
Mar 25, 2019
Sold by
Fish Ted H and Fish Angelica A
Bought by
Fish Ted and Fish Angelica A
Create a Home Valuation Report for This Property
The Home Valuation Report is an in-depth analysis detailing your home's value as well as a comparison with similar homes in the area
Home Values in the Area
Average Home Value in this Area
Purchase History
| Date | Buyer | Sale Price | Title Company |
|---|---|---|---|
| Fish David A | -- | Old Republic Title | |
| Fish David A | -- | None Listed On Document | |
| Fish David A | -- | None Listed On Document | |
| Fish David A | -- | None Listed On Document | |
| Fish Ted | -- | None Available |
Source: Public Records
Mortgage History
| Date | Status | Borrower | Loan Amount |
|---|---|---|---|
| Open | Fish David A | $200,000 |
Source: Public Records
Tax History
| Year | Tax Paid | Tax Assessment Tax Assessment Total Assessment is a certain percentage of the fair market value that is determined by local assessors to be the total taxable value of land and additions on the property. | Land | Improvement |
|---|---|---|---|---|
| 2025 | $1,418 | $184,690 | -- | -- |
| 2024 | $1,418 | $173,360 | $0 | $0 |
| 2023 | $1,309 | $172,095 | $0 | $0 |
| 2022 | $1,443 | $183,700 | $0 | $0 |
| 2021 | $1,256 | $242,300 | $116,600 | $125,700 |
| 2020 | $1,136 | $215,300 | $93,300 | $122,000 |
| 2019 | $1,012 | $199,400 | $93,300 | $106,100 |
| 2018 | $950 | $178,900 | $86,600 | $92,300 |
| 2017 | $882 | $88,935 | $0 | $0 |
| 2016 | $814 | $75,680 | $0 | $0 |
| 2015 | $825 | $72,600 | $0 | $0 |
| 2014 | $791 | $69,300 | $0 | $0 |
Source: Public Records
Map
Nearby Homes
Your Personal Tour Guide
Ask me questions while you tour the home.