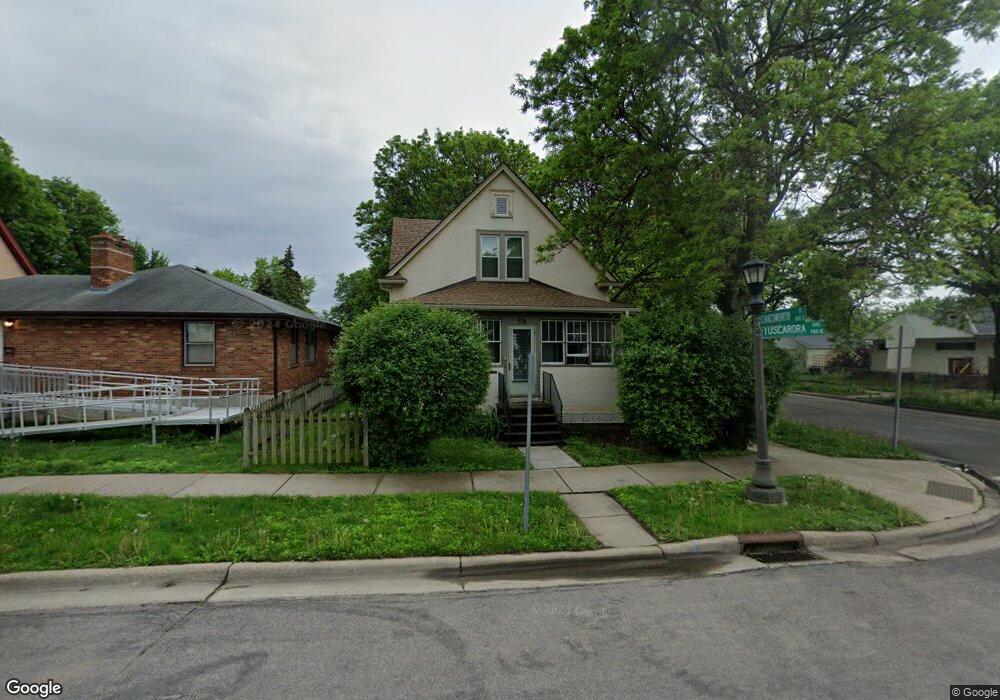
978 Tuscarora Ave Saint Paul, MN 55102
West Seventh NeighborhoodEstimated Value: $288,000 - $316,000
3
Beds
2
Baths
1,170
Sq Ft
$258/Sq Ft
Est. Value
About This Home
This home is located at 978 Tuscarora Ave, Saint Paul, MN 55102 and is currently estimated at $301,367, approximately $257 per square foot. 978 Tuscarora Ave is a home located in Ramsey County with nearby schools including Expo for Excellence Elementary School, Highland Park Middle School, and Highland Park Senior High.
Ownership History
Date
Name
Owned For
Owner Type
Purchase Details
Closed on
Apr 8, 2015
Sold by
Larson Robert Mark
Bought by
Lind Bernard J
Current Estimated Value
Home Financials for this Owner
Home Financials are based on the most recent Mortgage that was taken out on this home.
Original Mortgage
$7,500
Outstanding Balance
$5,797
Interest Rate
3.85%
Mortgage Type
Negative Amortization
Estimated Equity
$295,570
Purchase Details
Closed on
Mar 24, 2015
Sold by
Larson Robert M
Bought by
Provident Funding Associates Lp
Home Financials for this Owner
Home Financials are based on the most recent Mortgage that was taken out on this home.
Original Mortgage
$7,500
Outstanding Balance
$5,797
Interest Rate
3.85%
Mortgage Type
Negative Amortization
Estimated Equity
$295,570
Purchase Details
Closed on
Sep 26, 2000
Sold by
Wiseman John G and Booton Wiseman Celeste
Bought by
Stremcha Jesse M
Create a Home Valuation Report for This Property
The Home Valuation Report is an in-depth analysis detailing your home's value as well as a comparison with similar homes in the area
Home Values in the Area
Average Home Value in this Area
Purchase History
| Date | Buyer | Sale Price | Title Company |
|---|---|---|---|
| Lind Bernard J | $176,181 | Burnet Title | |
| Larson Robert M | $79,936 | None Available | |
| Provident Funding Associates Lp | $79,350 | None Available | |
| Stremcha Jesse M | $124,900 | -- |
Source: Public Records
Mortgage History
| Date | Status | Borrower | Loan Amount |
|---|---|---|---|
| Open | Larson Robert M | $7,500 | |
| Open | Lind Bernard J | $167,902 |
Source: Public Records
Tax History Compared to Growth
Tax History
| Year | Tax Paid | Tax Assessment Tax Assessment Total Assessment is a certain percentage of the fair market value that is determined by local assessors to be the total taxable value of land and additions on the property. | Land | Improvement |
|---|---|---|---|---|
| 2025 | $3,800 | $279,600 | $40,000 | $239,600 |
| 2023 | $3,800 | $254,100 | $40,000 | $214,100 |
| 2022 | $3,356 | $241,900 | $40,000 | $201,900 |
| 2021 | $3,314 | $219,900 | $40,000 | $179,900 |
| 2020 | $3,316 | $224,600 | $32,100 | $192,500 |
| 2019 | $3,030 | $211,100 | $32,100 | $179,000 |
| 2018 | $2,532 | $192,800 | $32,100 | $160,700 |
| 2017 | $2,686 | $170,100 | $32,100 | $138,000 |
| 2016 | $2,550 | $0 | $0 | $0 |
| 2015 | $2,898 | $171,600 | $21,900 | $149,700 |
| 2014 | $2,616 | $0 | $0 | $0 |
Source: Public Records
Map
Nearby Homes
- 1368 Pleasant Ave
- 576 Lexington Pkwy S
- 1271 - 1273 7th St W
- 528 Lexington Pkwy S
- 1071 Otto Ave
- 1001 James Ave
- 555 Montcalm Place
- 1116 James Ave
- 1129 Randolph Ave
- 1145 Randolph Ave
- 725 Watson Ave
- 1205 Eleanor Ave
- 791 Lexington Pkwy S
- 633 Griggs St S
- 1070 Jefferson Ave
- 416 View St
- 697 Tuscarora Ave
- 1049 7th St W
- 429 Bay St
- 1153 Juliet Ave
- 974 Tuscarora Ave
- 970 Tuscarora Ave
- 980 Tuscarora Ave
- 966 Tuscarora Ave
- 979 Bayard Ave
- 975 Bayard Ave
- 984 Tuscarora Ave
- 962 Tuscarora Ave
- 971 Bayard Ave
- 983 983 Bayard Ave
- 983 Bayard Ave
- 967 Bayard Ave
- 977 Tuscarora Ave
- 975 Tuscarora Ave
- 965 Tuscarora Ave
- 987 Bayard Ave
- 987 987 Bayard Ave
- 988 Tuscarora Ave
- 963 Bayard Ave
- 956 Tuscarora Ave