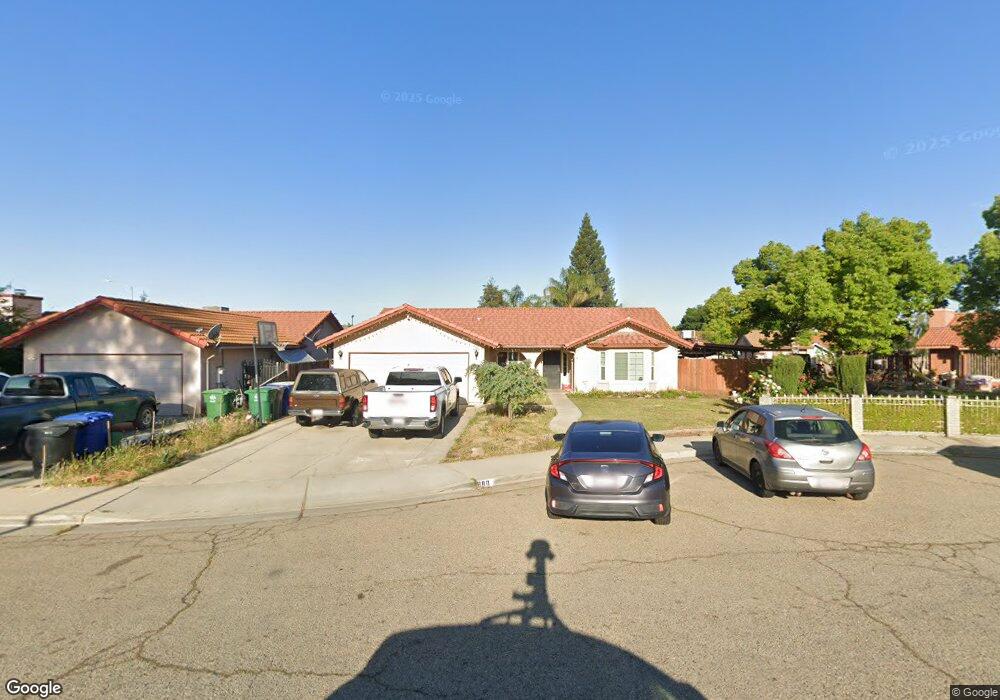
980 2nd Ct Sanger, CA 93657
Estimated Value: $338,193 - $391,000
4
Beds
2
Baths
1,554
Sq Ft
$237/Sq Ft
Est. Value
About This Home
This home is located at 980 2nd Ct, Sanger, CA 93657 and is currently estimated at $368,298, approximately $237 per square foot. 980 2nd Ct is a home located in Fresno County with nearby schools including Wilson Elementary School, Washington Academic Middle School, and Sanger High School.
Ownership History
Date
Name
Owned For
Owner Type
Purchase Details
Closed on
Jun 28, 2006
Sold by
Cantu Tiffany
Bought by
Cantu Richard
Current Estimated Value
Home Financials for this Owner
Home Financials are based on the most recent Mortgage that was taken out on this home.
Original Mortgage
$50,000
Outstanding Balance
$29,651
Interest Rate
6.63%
Mortgage Type
New Conventional
Estimated Equity
$338,647
Purchase Details
Closed on
Oct 26, 2005
Sold by
Cantu Tiffany
Bought by
Cantu Richard
Purchase Details
Closed on
Oct 14, 1993
Sold by
Central California Development Inc
Bought by
Cantu Richard and Cantu Tiffany
Home Financials for this Owner
Home Financials are based on the most recent Mortgage that was taken out on this home.
Original Mortgage
$91,721
Interest Rate
7.24%
Mortgage Type
FHA
Create a Home Valuation Report for This Property
The Home Valuation Report is an in-depth analysis detailing your home's value as well as a comparison with similar homes in the area
Home Values in the Area
Average Home Value in this Area
Purchase History
| Date | Buyer | Sale Price | Title Company |
|---|---|---|---|
| Cantu Richard | -- | Financial Title Company | |
| Cantu Richard | -- | None Available | |
| Cantu Richard | $93,000 | First American Title Ins Co |
Source: Public Records
Mortgage History
| Date | Status | Borrower | Loan Amount |
|---|---|---|---|
| Open | Cantu Richard | $50,000 | |
| Previous Owner | Cantu Richard | $91,721 |
Source: Public Records
Tax History Compared to Growth
Tax History
| Year | Tax Paid | Tax Assessment Tax Assessment Total Assessment is a certain percentage of the fair market value that is determined by local assessors to be the total taxable value of land and additions on the property. | Land | Improvement |
|---|---|---|---|---|
| 2025 | $3,875 | $157,200 | $33,982 | $123,218 |
| 2023 | $3,687 | $151,097 | $32,663 | $118,434 |
| 2022 | $3,634 | $148,135 | $32,023 | $116,112 |
| 2021 | $3,618 | $145,232 | $31,396 | $113,836 |
| 2020 | $3,521 | $143,744 | $31,075 | $112,669 |
| 2019 | $3,486 | $140,926 | $30,466 | $110,460 |
| 2018 | $3,410 | $138,164 | $29,869 | $108,295 |
| 2017 | $3,362 | $135,456 | $29,284 | $106,172 |
| 2016 | $3,267 | $132,801 | $28,710 | $104,091 |
| 2015 | $3,288 | $130,807 | $28,279 | $102,528 |
| 2014 | $1,458 | $128,246 | $27,726 | $100,520 |
Source: Public Records
Map
Nearby Homes