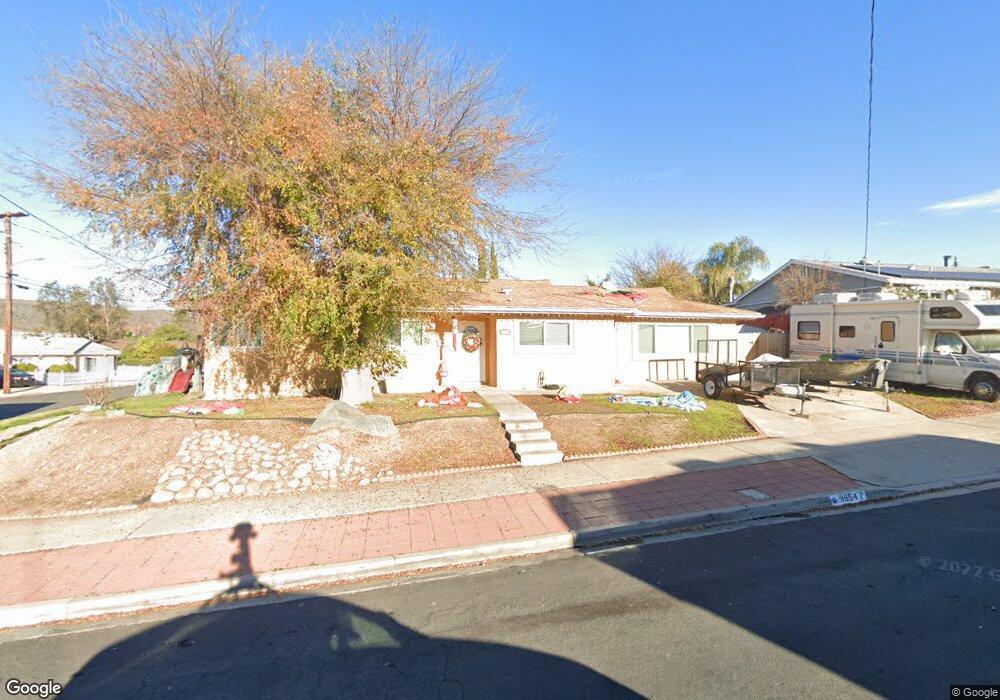
9854 Settle Rd Santee, CA 92071
Carlton Hills NeighborhoodEstimated Value: $784,137 - $831,000
3
Beds
2
Baths
1,400
Sq Ft
$581/Sq Ft
Est. Value
About This Home
This home is located at 9854 Settle Rd, Santee, CA 92071 and is currently estimated at $813,284, approximately $580 per square foot. 9854 Settle Rd is a home located in San Diego County with nearby schools including Sycamore Canyon Elementary School and West Hills High School.
Ownership History
Date
Name
Owned For
Owner Type
Purchase Details
Closed on
Dec 6, 2019
Sold by
Cerney Bret A
Bought by
Cerney Bret A and Cerney Stephanie L
Current Estimated Value
Home Financials for this Owner
Home Financials are based on the most recent Mortgage that was taken out on this home.
Original Mortgage
$49,000
Outstanding Balance
$41,323
Interest Rate
3.7%
Mortgage Type
Credit Line Revolving
Estimated Equity
$771,961
Purchase Details
Closed on
Apr 4, 2017
Sold by
Stratton Kathleen
Bought by
Cerney Bret A
Home Financials for this Owner
Home Financials are based on the most recent Mortgage that was taken out on this home.
Original Mortgage
$356,000
Outstanding Balance
$296,972
Interest Rate
4.3%
Mortgage Type
New Conventional
Estimated Equity
$516,312
Purchase Details
Closed on
Nov 28, 2000
Sold by
Hausotter Isobel L Trust 05-17-99 and Isobel L
Bought by
Kost James and Kost Shelly
Purchase Details
Closed on
May 17, 1999
Sold by
Hausotter Isobel L
Bought by
Hausotter Isobel L
Create a Home Valuation Report for This Property
The Home Valuation Report is an in-depth analysis detailing your home's value as well as a comparison with similar homes in the area
Home Values in the Area
Average Home Value in this Area
Purchase History
| Date | Buyer | Sale Price | Title Company |
|---|---|---|---|
| Cerney Bret A | -- | Lawyers Title | |
| Cerney Bret A | $445,000 | First American Title | |
| Kost James | -- | -- | |
| Hausotter Isobel L | -- | -- |
Source: Public Records
Mortgage History
| Date | Status | Borrower | Loan Amount |
|---|---|---|---|
| Open | Cerney Bret A | $49,000 | |
| Open | Cerney Bret A | $356,000 |
Source: Public Records
Tax History
| Year | Tax Paid | Tax Assessment Tax Assessment Total Assessment is a certain percentage of the fair market value that is determined by local assessors to be the total taxable value of land and additions on the property. | Land | Improvement |
|---|---|---|---|---|
| 2025 | $6,146 | $516,453 | $144,814 | $371,639 |
| 2024 | $6,146 | $506,327 | $141,975 | $364,352 |
| 2023 | $5,958 | $496,400 | $139,192 | $357,208 |
| 2022 | $5,916 | $486,667 | $136,463 | $350,204 |
| 2021 | $5,835 | $477,126 | $133,788 | $343,338 |
| 2020 | $5,763 | $472,235 | $132,417 | $339,818 |
| 2019 | $5,479 | $462,976 | $129,821 | $333,155 |
| 2018 | $5,366 | $453,899 | $127,276 | $326,623 |
| 2017 | $160 | $42,285 | $11,857 | $30,428 |
| 2016 | $538 | $41,457 | $11,625 | $29,832 |
| 2015 | $530 | $40,835 | $11,451 | $29,384 |
| 2014 | $520 | $40,036 | $11,227 | $28,809 |
Source: Public Records
Map
Nearby Homes
- 9649 Derald Rd
- 10118 Swanton Dr
- 8810 Wigwam Ct
- 9213 Fenway Rd
- 9243 Stoyer Dr
- 8514 Boulder Way
- 9410 Pike Rd
- 9462 Doheny Rd
- 9409 Pike Rd
- 10354 Settle Rd
- 9542 Markwood Dr
- 9722 Roe Dr
- 9401 Carlton Oaks Dr Unit E
- 10504 Strathmore Dr
- 9219 Inverness Rd
- 405 Whispering Willow Dr Unit E
- 9048 Willowgrove Place
- 9349 Nalini Ct
- 9325 Nalini Ct Unit 1501
- 9081 Inverness Rd
Your Personal Tour Guide
Ask me questions while you tour the home.