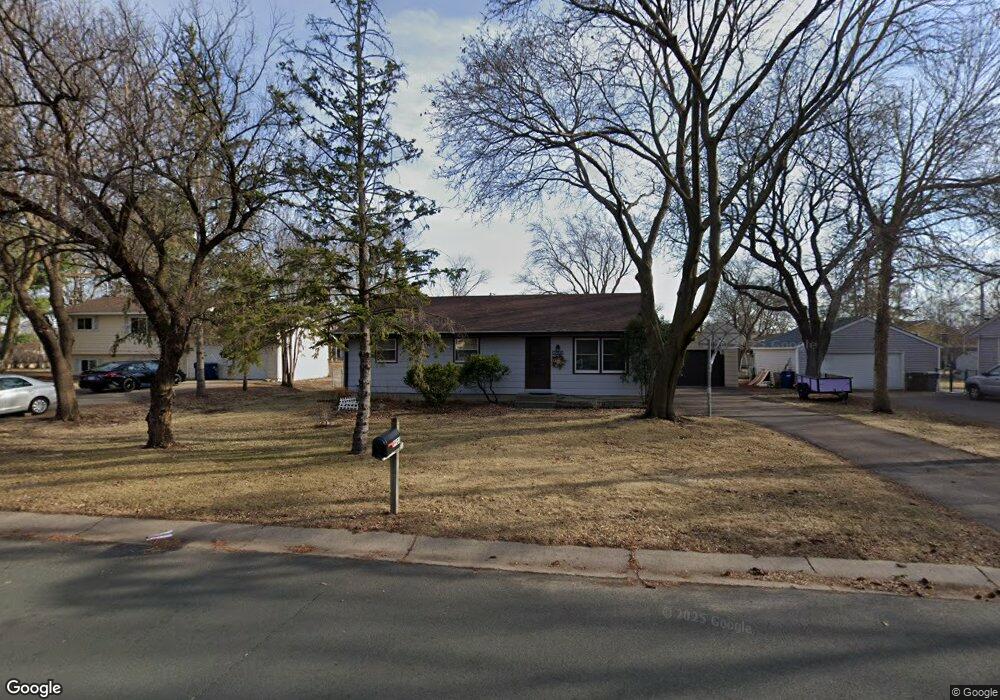
9903 94th Place N Maple Grove, MN 55369
Estimated Value: $327,000 - $370,542
3
Beds
2
Baths
1,092
Sq Ft
$321/Sq Ft
Est. Value
About This Home
This home is located at 9903 94th Place N, Maple Grove, MN 55369 and is currently estimated at $350,386, approximately $320 per square foot. 9903 94th Place N is a home located in Hennepin County with nearby schools including Elm Creek Elementary School, Osseo Middle School, and Osseo Senior High School.
Ownership History
Date
Name
Owned For
Owner Type
Purchase Details
Closed on
Feb 6, 2015
Bought by
Ludwig Joseph Joseph
Current Estimated Value
Home Financials for this Owner
Home Financials are based on the most recent Mortgage that was taken out on this home.
Original Mortgage
$129,944
Interest Rate
3.75%
Mortgage Type
FHA
Purchase Details
Closed on
Oct 28, 2011
Sold by
Esquire Investments Llc
Bought by
Ludwig Joseph W and Ludwig Yong J
Purchase Details
Closed on
Oct 26, 2011
Sold by
The Bank Of New York Mellon
Bought by
Esquire Investments Llc
Purchase Details
Closed on
Mar 10, 2011
Sold by
Royle Keith A
Bought by
The Bank Of New York Mellon
Purchase Details
Closed on
Feb 16, 2006
Sold by
Vankoeverden Wilhelmus J T and Vankoeverden Christine A
Bought by
Royle Keith A
Create a Home Valuation Report for This Property
The Home Valuation Report is an in-depth analysis detailing your home's value as well as a comparison with similar homes in the area
Home Values in the Area
Average Home Value in this Area
Purchase History
| Date | Buyer | Sale Price | Title Company |
|---|---|---|---|
| Ludwig Joseph Joseph | $130,400 | -- | |
| Ludwig Joseph W | $130,387 | Timios Inc | |
| Ludwig Joseph W | $110,414 | Premier Title | |
| Esquire Investments Llc | $115,000 | Prism Title & Closing Servic | |
| The Bank Of New York Mellon | $247,355 | -- | |
| Royle Keith A | $237,000 | -- |
Source: Public Records
Mortgage History
| Date | Status | Borrower | Loan Amount |
|---|---|---|---|
| Previous Owner | Ludwig Joseph W | $129,944 | |
| Closed | Ludwig Joseph W | $0 |
Source: Public Records
Tax History Compared to Growth
Tax History
| Year | Tax Paid | Tax Assessment Tax Assessment Total Assessment is a certain percentage of the fair market value that is determined by local assessors to be the total taxable value of land and additions on the property. | Land | Improvement |
|---|---|---|---|---|
| 2024 | $3,806 | $326,900 | $102,100 | $224,800 |
| 2023 | $3,740 | $325,600 | $96,300 | $229,300 |
| 2022 | $3,433 | $328,500 | $90,000 | $238,500 |
| 2021 | $3,167 | $262,900 | $66,900 | $196,000 |
| 2020 | $3,184 | $238,200 | $50,500 | $187,700 |
| 2019 | $3,160 | $229,300 | $50,500 | $178,800 |
| 2018 | $2,866 | $216,500 | $46,200 | $170,300 |
| 2017 | $2,765 | $180,100 | $46,500 | $133,600 |
| 2016 | $2,758 | $177,600 | $46,500 | $131,100 |
| 2015 | $2,683 | $168,700 | $39,500 | $129,200 |
| 2014 | -- | $154,800 | $34,500 | $120,300 |
Source: Public Records
Map
Nearby Homes
- 10162 93rd Ave N
- 9501 Revere Ln N
- 10000 Nathan Ln N
- 225 4th Ave NE
- 6866 Zachary Ln N
- 14877 106th Ave N
- 100 4th Ave SE
- 9880 Cottonwood Ln N
- 9667 103rd Place N
- 9201 Forestview Ln N
- 8864 Cottonwood Ln N
- 8764 Cottonwood Ln N
- 9058 Goldenrod Ln N
- 8704 Cottonwood Ln N
- 11631 88th Ave N
- 11760 88th Place N
- 9132 Kirkwood Ln N
- 11043 104th Place N
- 9311 Kirkwood Ln N
- 9323 Kirkwood Ln N
- 9929 94th Place N
- 9881 94th Place N
- 9902 94th Ave N
- 9912 94th Ave N
- 9450 Orleans Ln N
- 9953 94th Place N
- 9874 94th Ave N
- 9865 94th Place N
- 9952 94th Ave N
- 9886 94th Place N
- 9851 94th Place N
- 9464 Orleans Ln N
- 9979 94th Place N
- 9850 94th Ave N
- 9868 94th Place N
- 9451 Orleans Ln N
- 10002 94th Ave N
- 9800 94th Ave N
- 9480 Orleans Ln N
- 10007 94th Place N