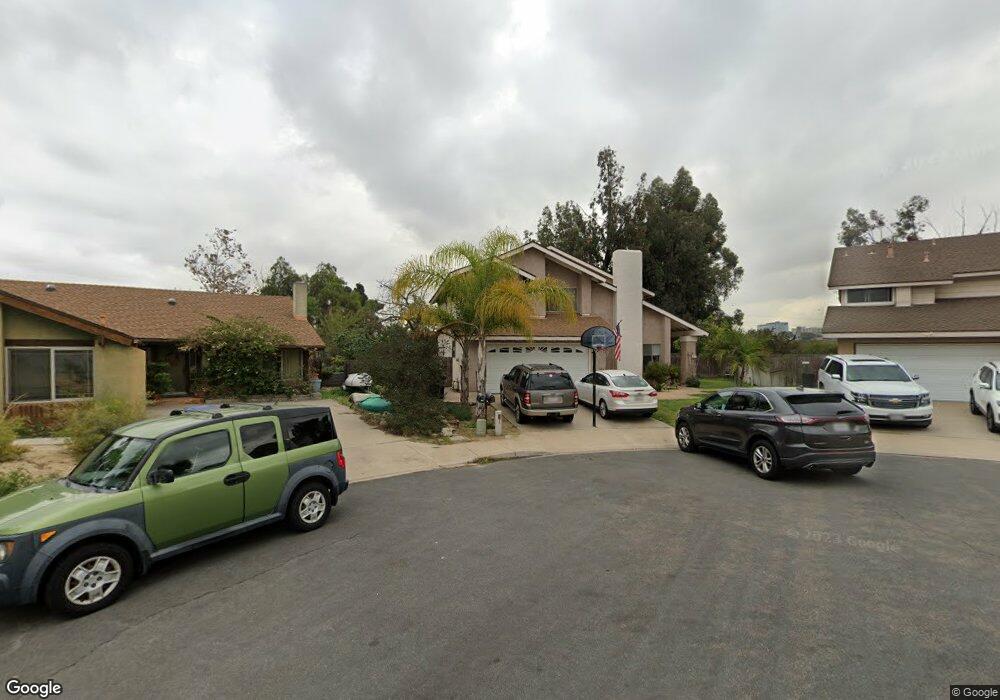
991 Loma View Chula Vista, CA 91910
Rancho Del Rey NeighborhoodEstimated Value: $934,479 - $1,044,000
4
Beds
3
Baths
2,074
Sq Ft
$481/Sq Ft
Est. Value
About This Home
This home is located at 991 Loma View, Chula Vista, CA 91910 and is currently estimated at $996,620, approximately $480 per square foot. 991 Loma View is a home located in San Diego County with nearby schools including Casillas Elementary School, Rancho Del Rey Middle School, and Otay Ranch Senior High School.
Ownership History
Date
Name
Owned For
Owner Type
Purchase Details
Closed on
Mar 27, 2018
Sold by
Melendez Phil
Bought by
Melendez Phil and Melendez Laura Alicia
Current Estimated Value
Purchase Details
Closed on
Jul 21, 1998
Sold by
Melendez Laura Alicia
Bought by
Melendez Phil
Home Financials for this Owner
Home Financials are based on the most recent Mortgage that was taken out on this home.
Original Mortgage
$209,000
Interest Rate
6.88%
Purchase Details
Closed on
Jul 6, 1998
Sold by
Alvarez Joaquin J and Alvarez Rebecca M
Bought by
Melendez Phil
Home Financials for this Owner
Home Financials are based on the most recent Mortgage that was taken out on this home.
Original Mortgage
$209,000
Interest Rate
6.88%
Purchase Details
Closed on
Mar 21, 1985
Create a Home Valuation Report for This Property
The Home Valuation Report is an in-depth analysis detailing your home's value as well as a comparison with similar homes in the area
Home Values in the Area
Average Home Value in this Area
Purchase History
| Date | Buyer | Sale Price | Title Company |
|---|---|---|---|
| Melendez Phil | -- | None Available | |
| Melendez Phil | -- | Chicago Title Co | |
| Melendez Phil | $220,000 | Chicago Title Co | |
| -- | $135,000 | -- |
Source: Public Records
Mortgage History
| Date | Status | Borrower | Loan Amount |
|---|---|---|---|
| Previous Owner | Melendez Phil | $209,000 |
Source: Public Records
Tax History Compared to Growth
Tax History
| Year | Tax Paid | Tax Assessment Tax Assessment Total Assessment is a certain percentage of the fair market value that is determined by local assessors to be the total taxable value of land and additions on the property. | Land | Improvement |
|---|---|---|---|---|
| 2025 | $4,144 | $344,866 | $115,993 | $228,873 |
| 2024 | $4,144 | $338,105 | $113,719 | $224,386 |
| 2023 | $4,081 | $331,477 | $111,490 | $219,987 |
| 2022 | $3,960 | $324,978 | $109,304 | $215,674 |
| 2021 | $3,871 | $318,607 | $107,161 | $211,446 |
| 2020 | $3,780 | $315,341 | $106,063 | $209,278 |
| 2019 | $3,682 | $309,159 | $103,984 | $205,175 |
| 2018 | $3,807 | $303,098 | $101,946 | $201,152 |
| 2017 | $3,542 | $297,156 | $99,948 | $197,208 |
| 2016 | $3,458 | $291,331 | $97,989 | $193,342 |
| 2015 | $3,562 | $286,956 | $96,518 | $190,438 |
| 2014 | $3,350 | $281,336 | $94,628 | $186,708 |
Source: Public Records
Map
Nearby Homes
- 1002 Cholla Place
- 1008 Calma Dr
- 820 Chervil Ct
- 626 Mariposa Cir
- 1029 Vista Oak Place
- 640 E J St
- 566 Telegraph Canyon Rd Unit A
- 554 Telegraph Canyon Rd Unit F
- 491 Nanette St
- 548 Telegraph Canyon Rd Unit D
- 486 E Naples St
- 578 Nantucket Dr
- 843 Calle Ciela Vista Unit 20
- 838 David Dr
- 1169 Oasis Ave
- 1158 Oasis Ave
- 589 E J St
- 484 Hale St
- 826 Floyd Ave
- 793 Vada St Unit 2