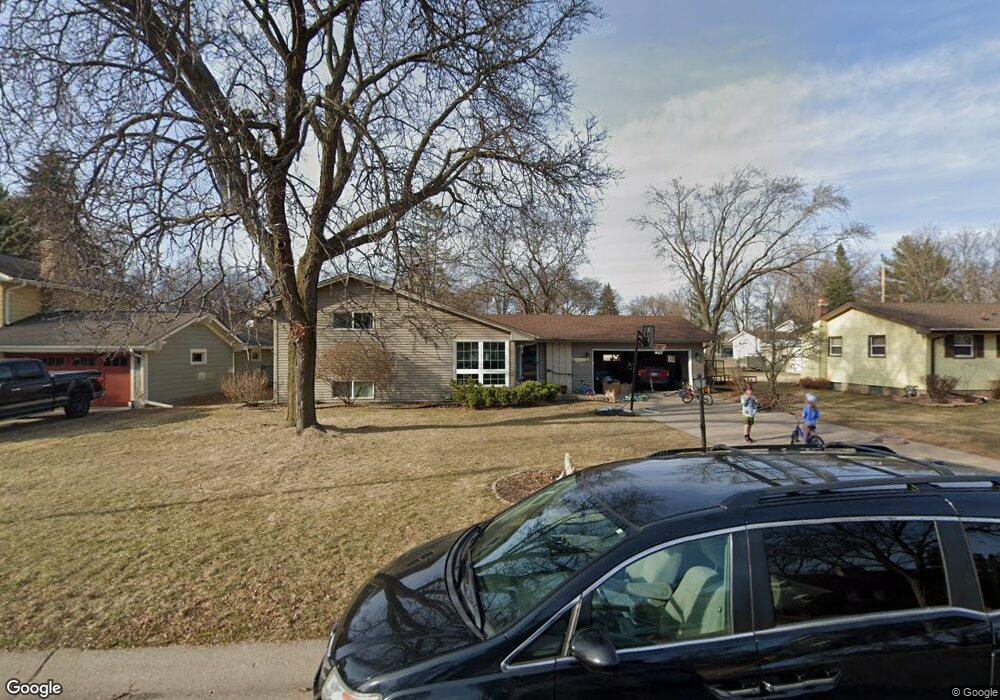
9912 94th Ave N Maple Grove, MN 55369
Estimated Value: $352,000 - $383,383
4
Beds
2
Baths
1,332
Sq Ft
$275/Sq Ft
Est. Value
About This Home
This home is located at 9912 94th Ave N, Maple Grove, MN 55369 and is currently estimated at $366,596, approximately $275 per square foot. 9912 94th Ave N is a home located in Hennepin County with nearby schools including Elm Creek Elementary School, Osseo Middle School, and Osseo Senior High School.
Ownership History
Date
Name
Owned For
Owner Type
Purchase Details
Closed on
Jul 28, 2017
Sold by
Nystrom Laura and Summers Colin
Bought by
Hicks Samuel S and Hurt Nicole E
Current Estimated Value
Home Financials for this Owner
Home Financials are based on the most recent Mortgage that was taken out on this home.
Original Mortgage
$212,000
Outstanding Balance
$176,514
Interest Rate
3.88%
Mortgage Type
New Conventional
Estimated Equity
$190,082
Purchase Details
Closed on
Jun 11, 2015
Sold by
Jeet Hardat and Jeet Chandrowtie
Bought by
Nystrom Laura and Summers Colin
Home Financials for this Owner
Home Financials are based on the most recent Mortgage that was taken out on this home.
Original Mortgage
$217,183
Interest Rate
0.78%
Mortgage Type
New Conventional
Purchase Details
Closed on
Oct 26, 2007
Sold by
Quintuna Libio and Mozo Jenny Sashamit Alvarado
Bought by
Jeet Hardat and Jeet Chandrowtie
Purchase Details
Closed on
Nov 29, 2005
Sold by
Naddy Kevin and Naddy Nancy
Bought by
Quintuna Libio
Create a Home Valuation Report for This Property
The Home Valuation Report is an in-depth analysis detailing your home's value as well as a comparison with similar homes in the area
Home Values in the Area
Average Home Value in this Area
Purchase History
| Date | Buyer | Sale Price | Title Company |
|---|---|---|---|
| Hicks Samuel S | $265,000 | All American Title Co Inc | |
| Nystrom Laura | $223,900 | All American Title Company | |
| Jeet Hardat | $206,515 | -- | |
| Quintuna Libio | $242,000 | -- |
Source: Public Records
Mortgage History
| Date | Status | Borrower | Loan Amount |
|---|---|---|---|
| Open | Hicks Samuel S | $212,000 | |
| Previous Owner | Nystrom Laura | $217,183 |
Source: Public Records
Tax History Compared to Growth
Tax History
| Year | Tax Paid | Tax Assessment Tax Assessment Total Assessment is a certain percentage of the fair market value that is determined by local assessors to be the total taxable value of land and additions on the property. | Land | Improvement |
|---|---|---|---|---|
| 2024 | $3,995 | $341,400 | $102,100 | $239,300 |
| 2023 | $3,962 | $343,300 | $96,300 | $247,000 |
| 2022 | $3,271 | $339,100 | $90,000 | $249,100 |
| 2021 | $3,041 | $279,600 | $66,900 | $212,700 |
| 2020 | $3,096 | $257,300 | $50,500 | $206,800 |
| 2019 | $3,095 | $250,200 | $50,500 | $199,700 |
| 2018 | $2,876 | $237,800 | $46,200 | $191,600 |
| 2017 | $2,868 | $210,900 | $46,500 | $164,400 |
| 2016 | $2,781 | $202,800 | $46,500 | $156,300 |
| 2015 | $2,690 | $192,200 | $39,500 | $152,700 |
| 2014 | -- | $173,600 | $34,500 | $139,100 |
Source: Public Records
Map
Nearby Homes
- 10162 93rd Ave N
- 9501 Revere Ln N
- 225 4th Ave NE
- 6866 Zachary Ln N
- 10000 Nathan Ln N
- 14877 106th Ave N
- 100 4th Ave SE
- 125 7th Ave SE
- 9880 Cottonwood Ln N
- 8864 Cottonwood Ln N
- 9201 Forestview Ln N
- 9667 103rd Place N
- 8764 Cottonwood Ln N
- 9058 Goldenrod Ln N
- 8704 Cottonwood Ln N
- 11631 88th Ave N
- 11760 88th Place N
- 9132 Kirkwood Ln N
- 9311 Kirkwood Ln N
- 9323 Kirkwood Ln N
- 9952 94th Ave N
- 9902 94th Ave N
- 9929 94th Place N
- 9903 94th Place N
- 10002 94th Ave N
- 9953 94th Place N
- 9874 94th Ave N
- 9907 94th Ave N
- 9881 94th Place N
- 9903 94th Ave N
- 9979 94th Place N
- 9967 94th Ave N
- 10006 94th Ave N
- 9877 94th Ave N
- 9850 94th Ave N
- 10007 94th Place N
- 10009 94th Ave N
- 9865 94th Place N
- 9450 Orleans Ln N
- 9920 93rd Place N